Time Analysis
Juan Pablo Bertucci
07/06/2021
Abstract
This document has some overall analysis of time patterns obtained by the surveys, that is, when weekday trips take place in mteropolitan areas. These are disaggregated by travel mode, motive, and socioeconomic data.
1 General
First, we take a look at the distribution of trip starting and ending time for the six cities:
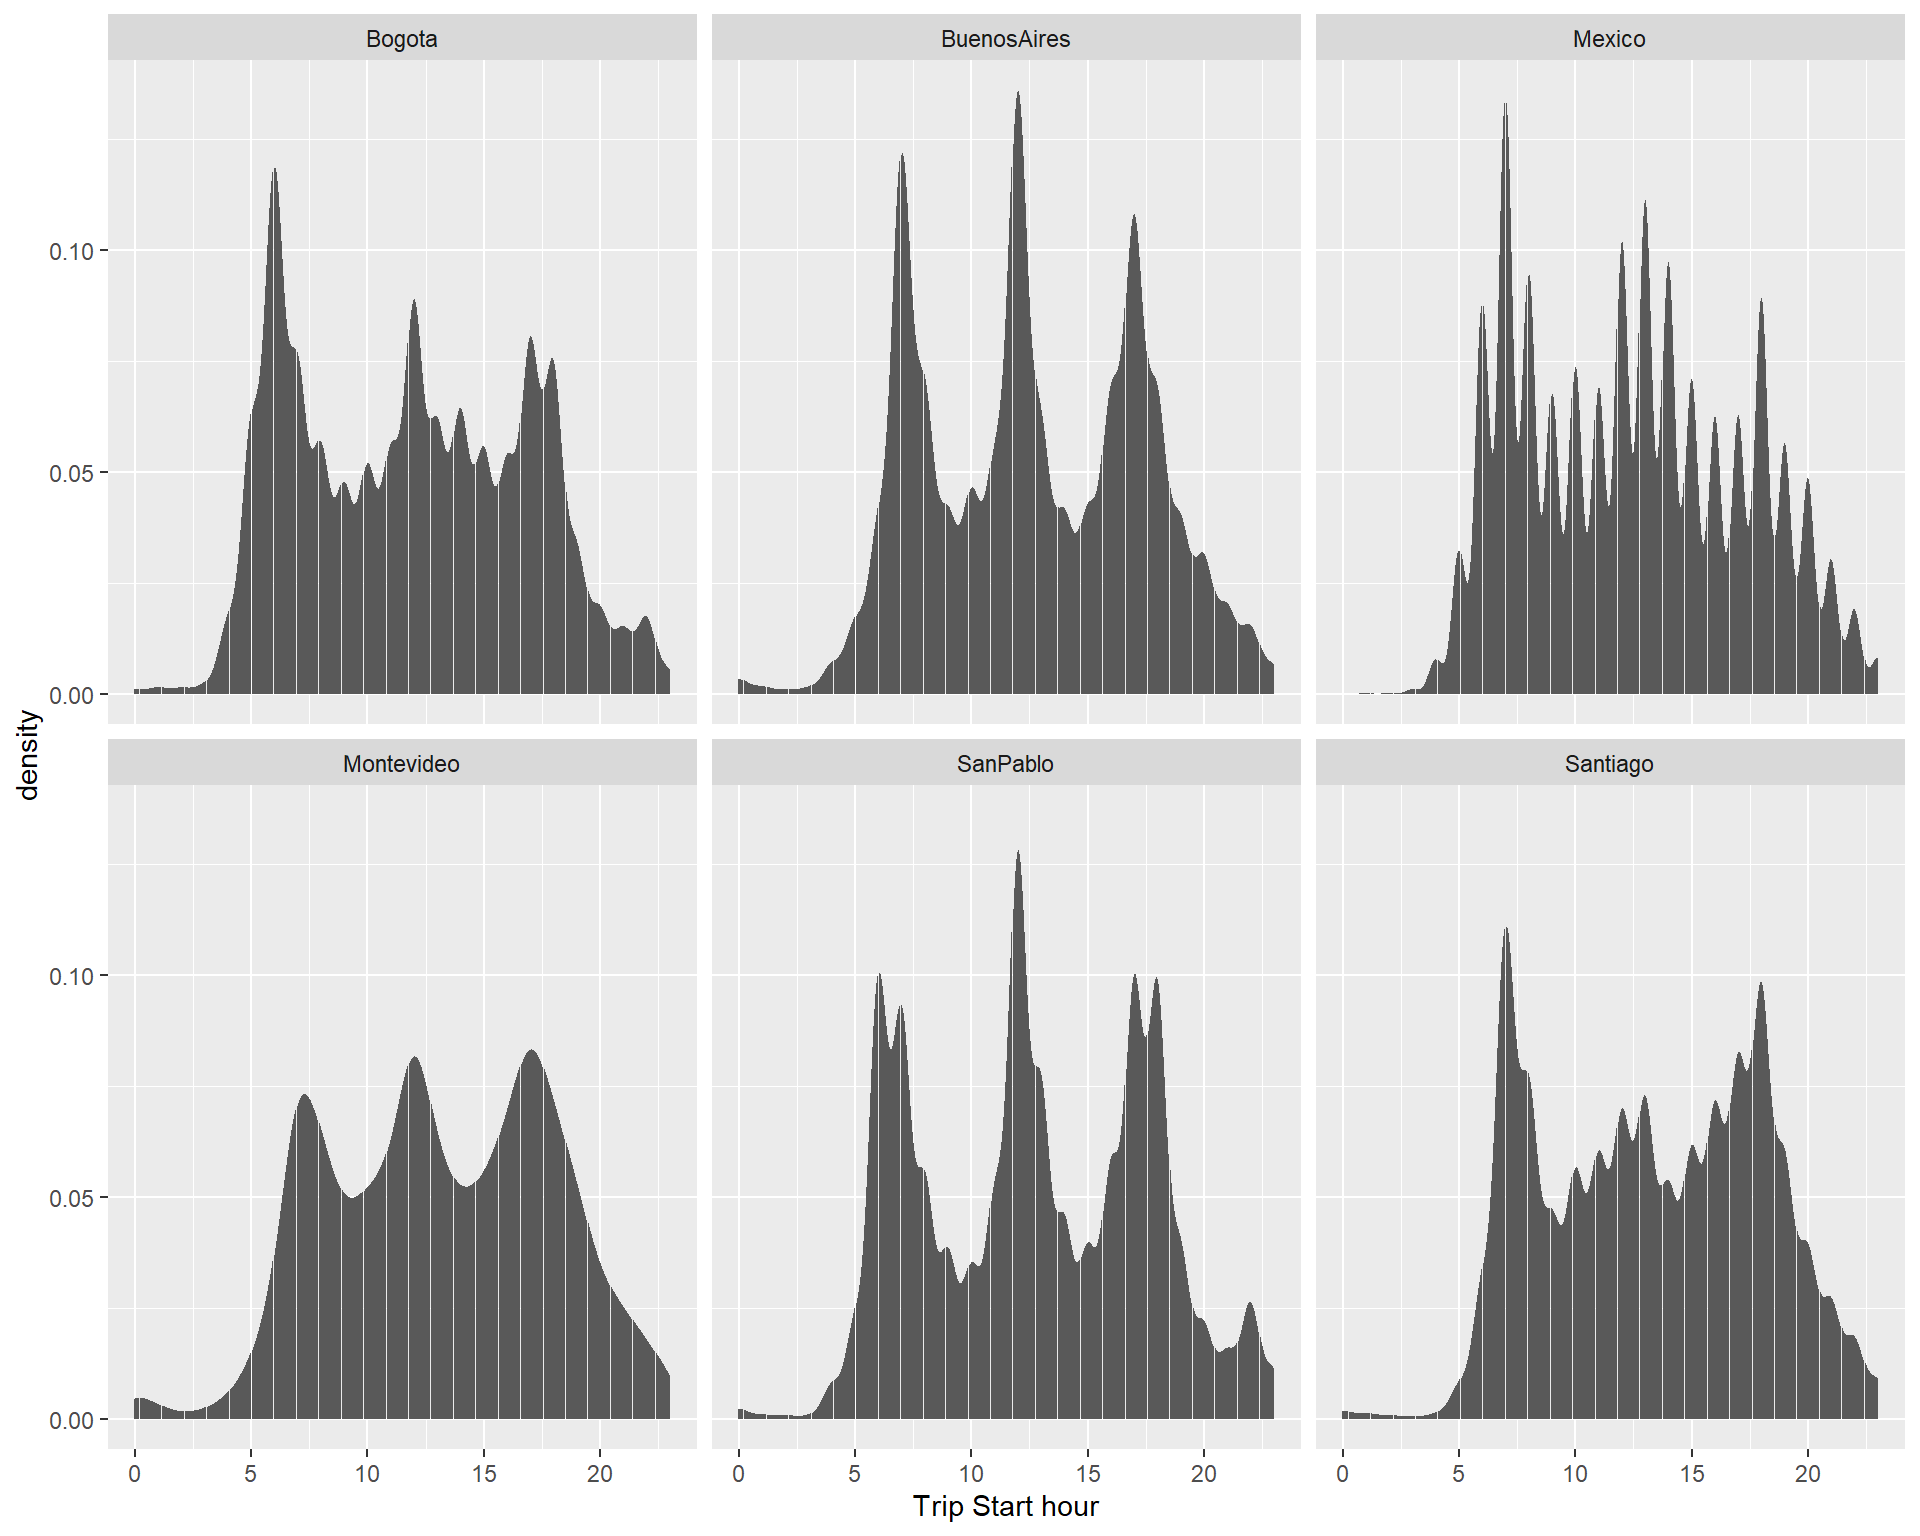
Montevideo shows a very smooth curve, while Buenos Aires and Sao Paulo show much more abrupt peaks. Santiago and Bogota start showing a high degree of noise (high frequency peaks), a pattern exacerbated in Mexico city. This shows a substantial difference in the time patterns of its citizens, but also in the urban morphology: more centers and a very redundant transit system yields much more variability in the trip starting times.
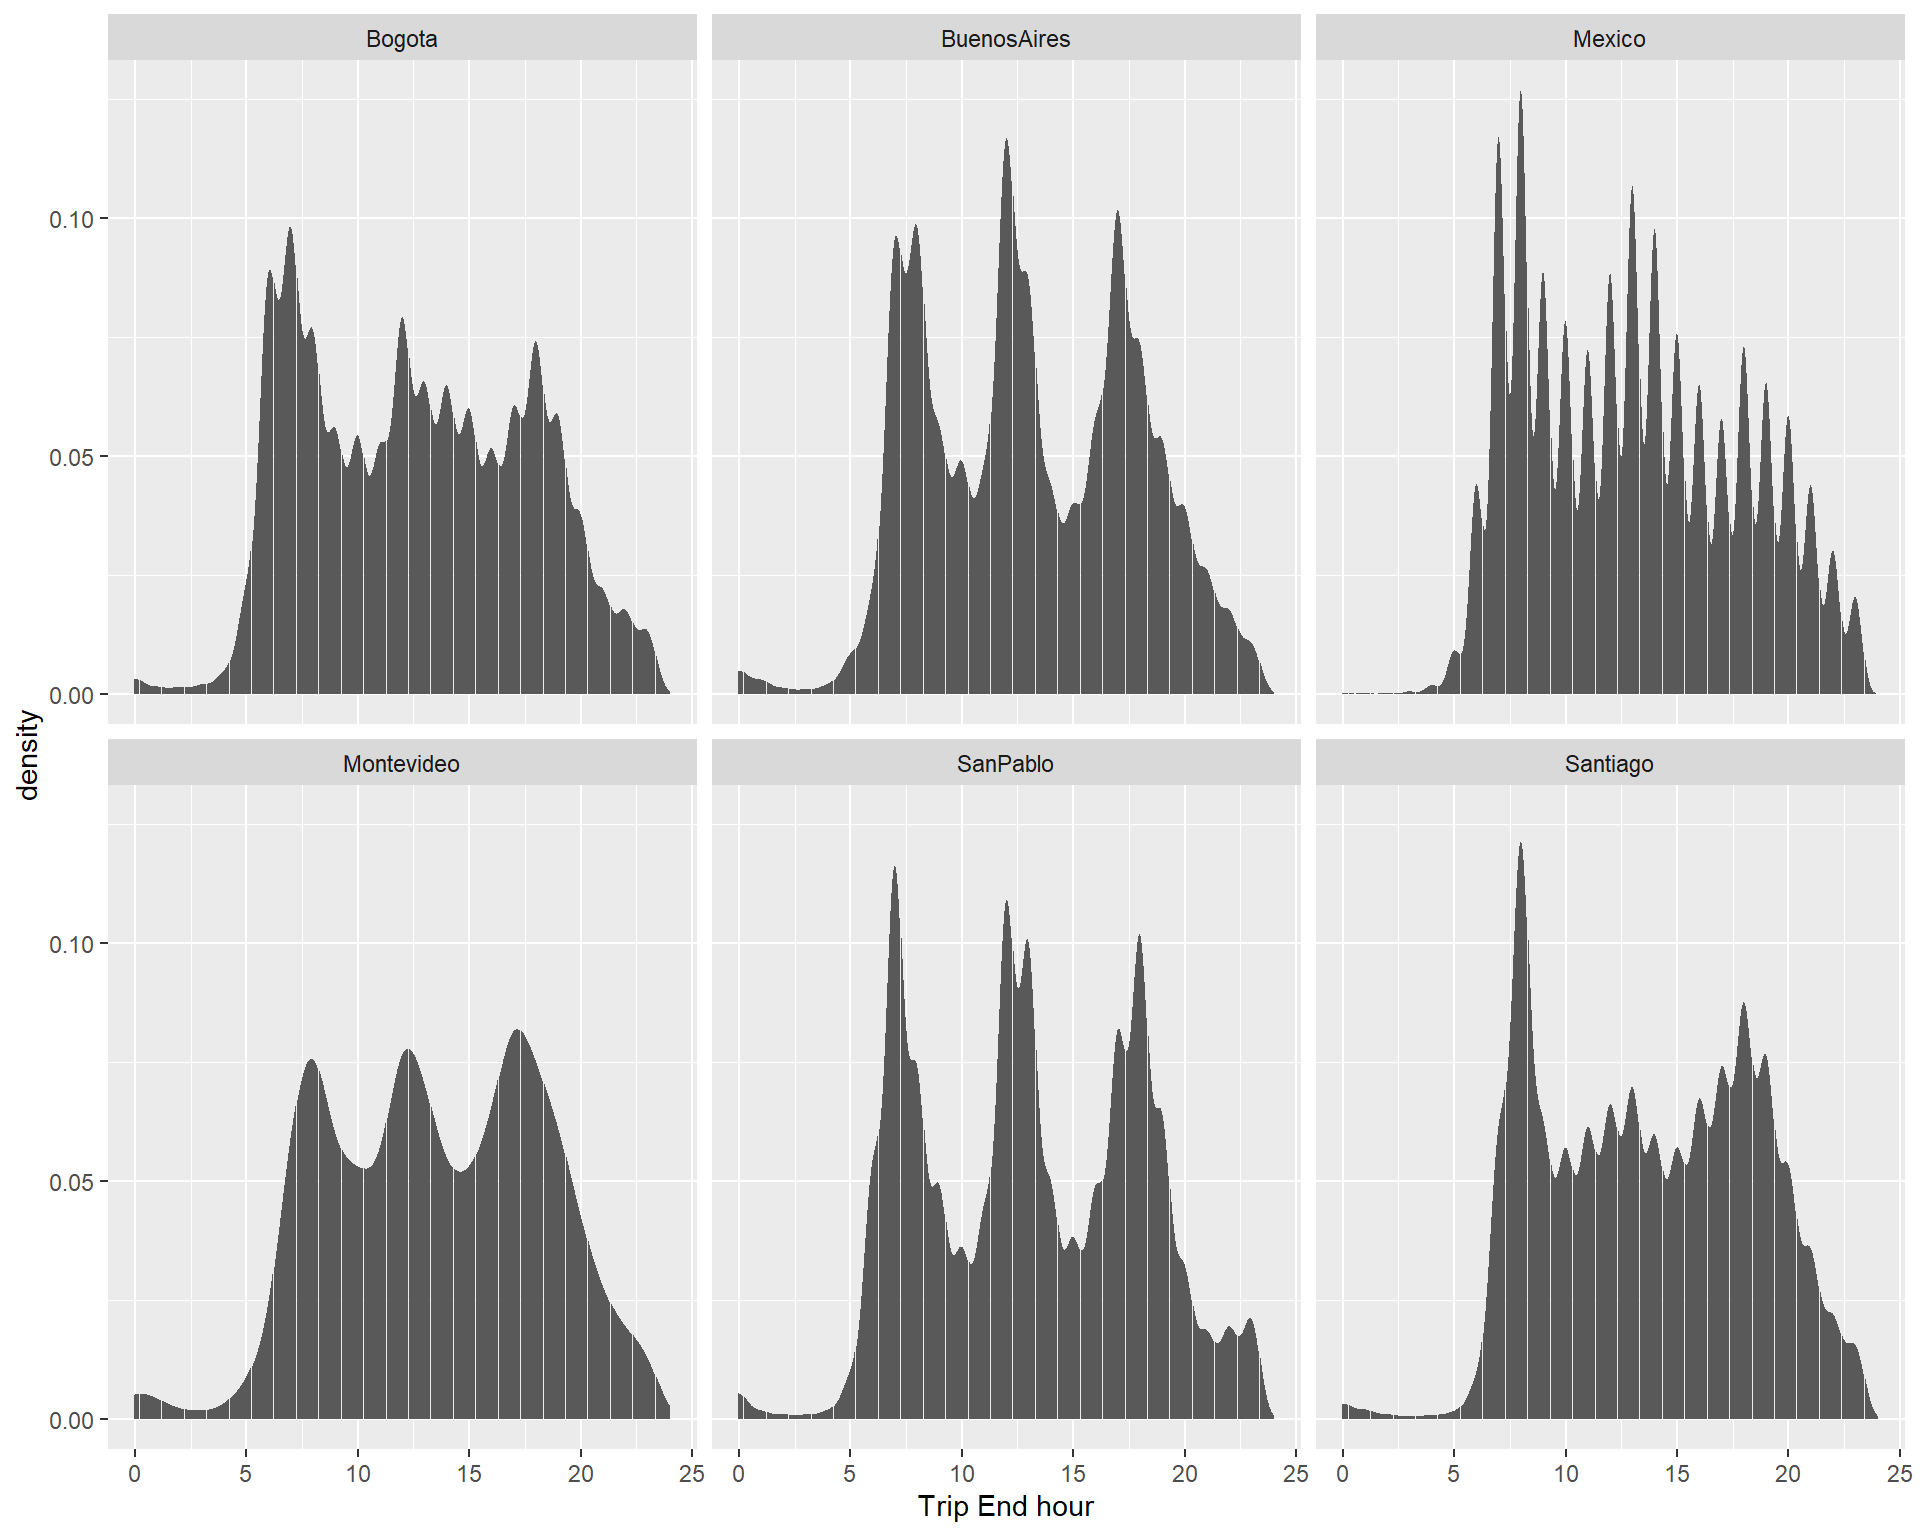
We observe the distributions for trips start and trip ending times to be very similar, owing to the fact most trips take an hour or less to be performed:
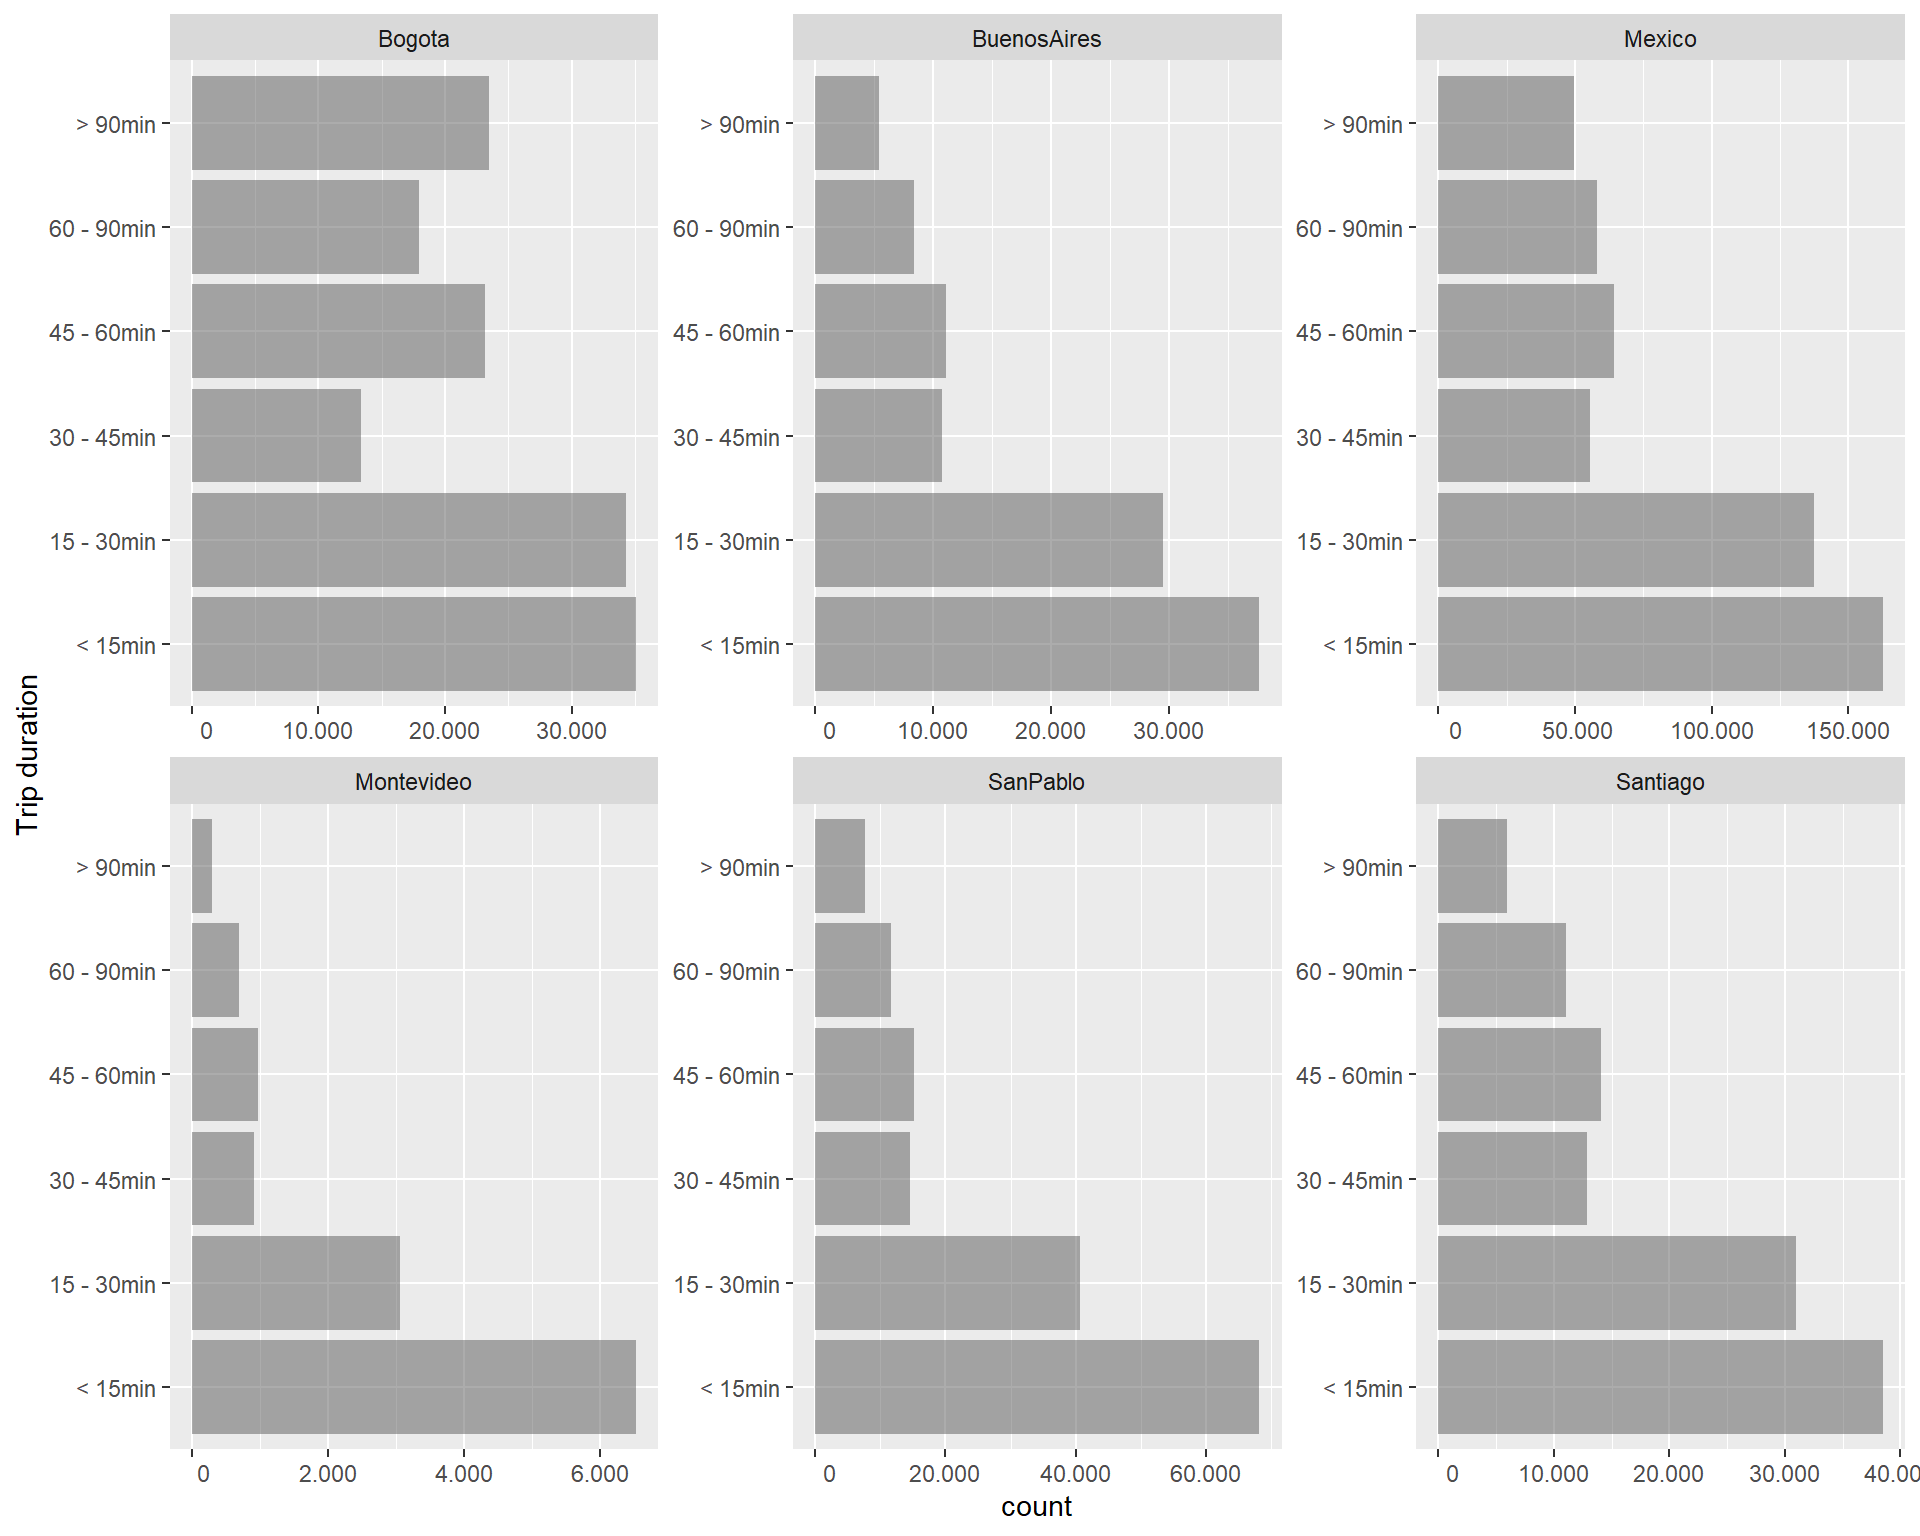
Hence we look only at trip start times. We observe the distinct distribution of Bogota, with a larger share of longer trips.
2 Gender
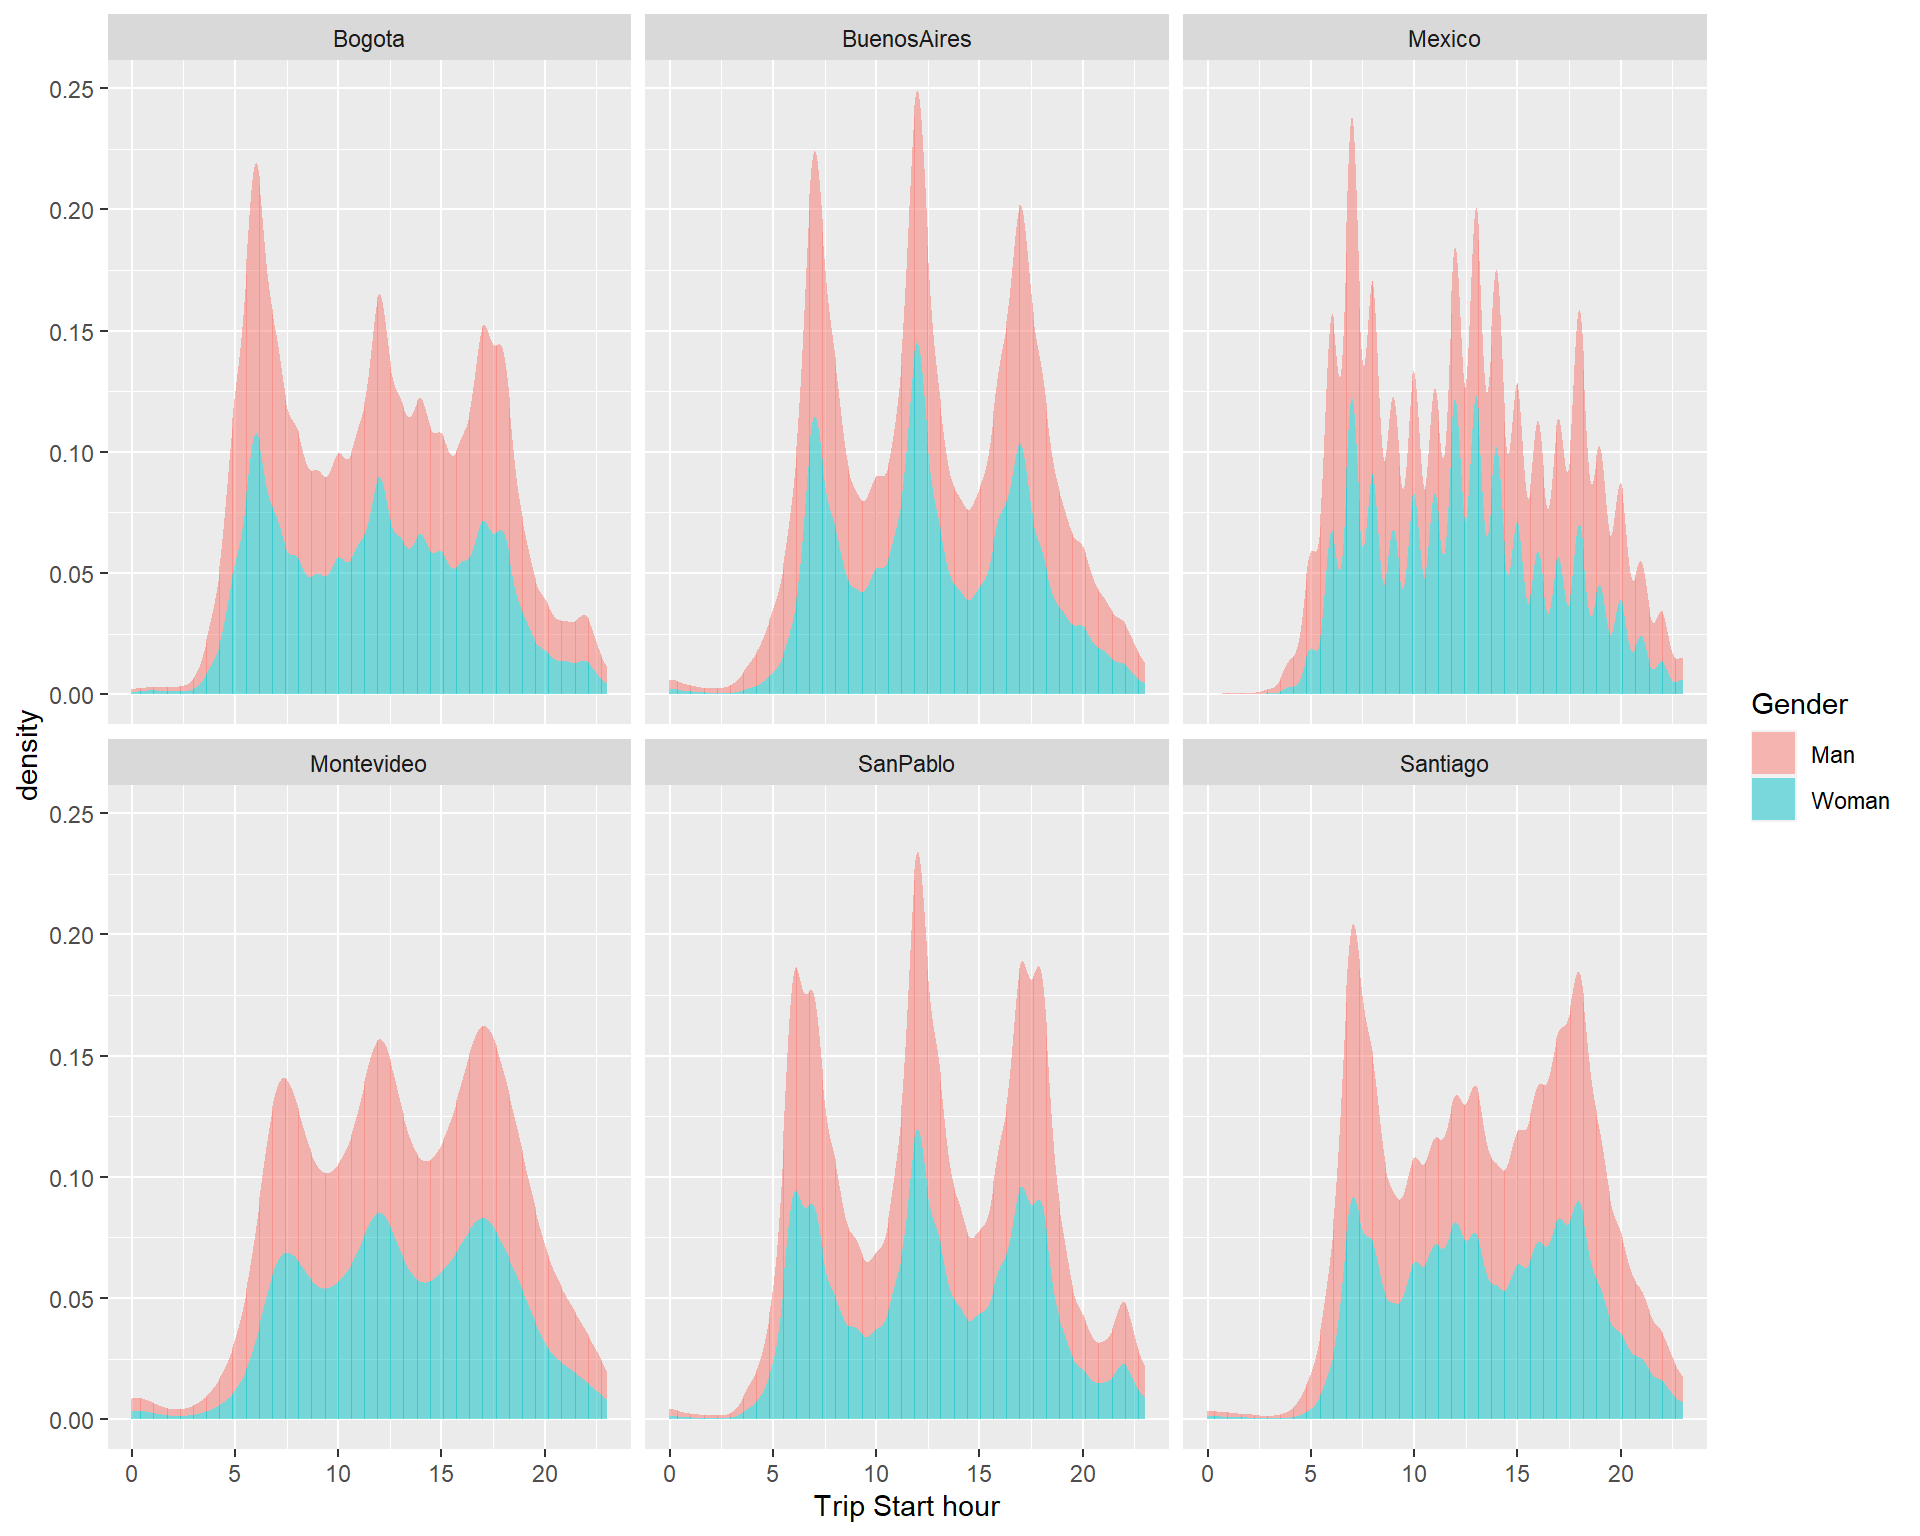
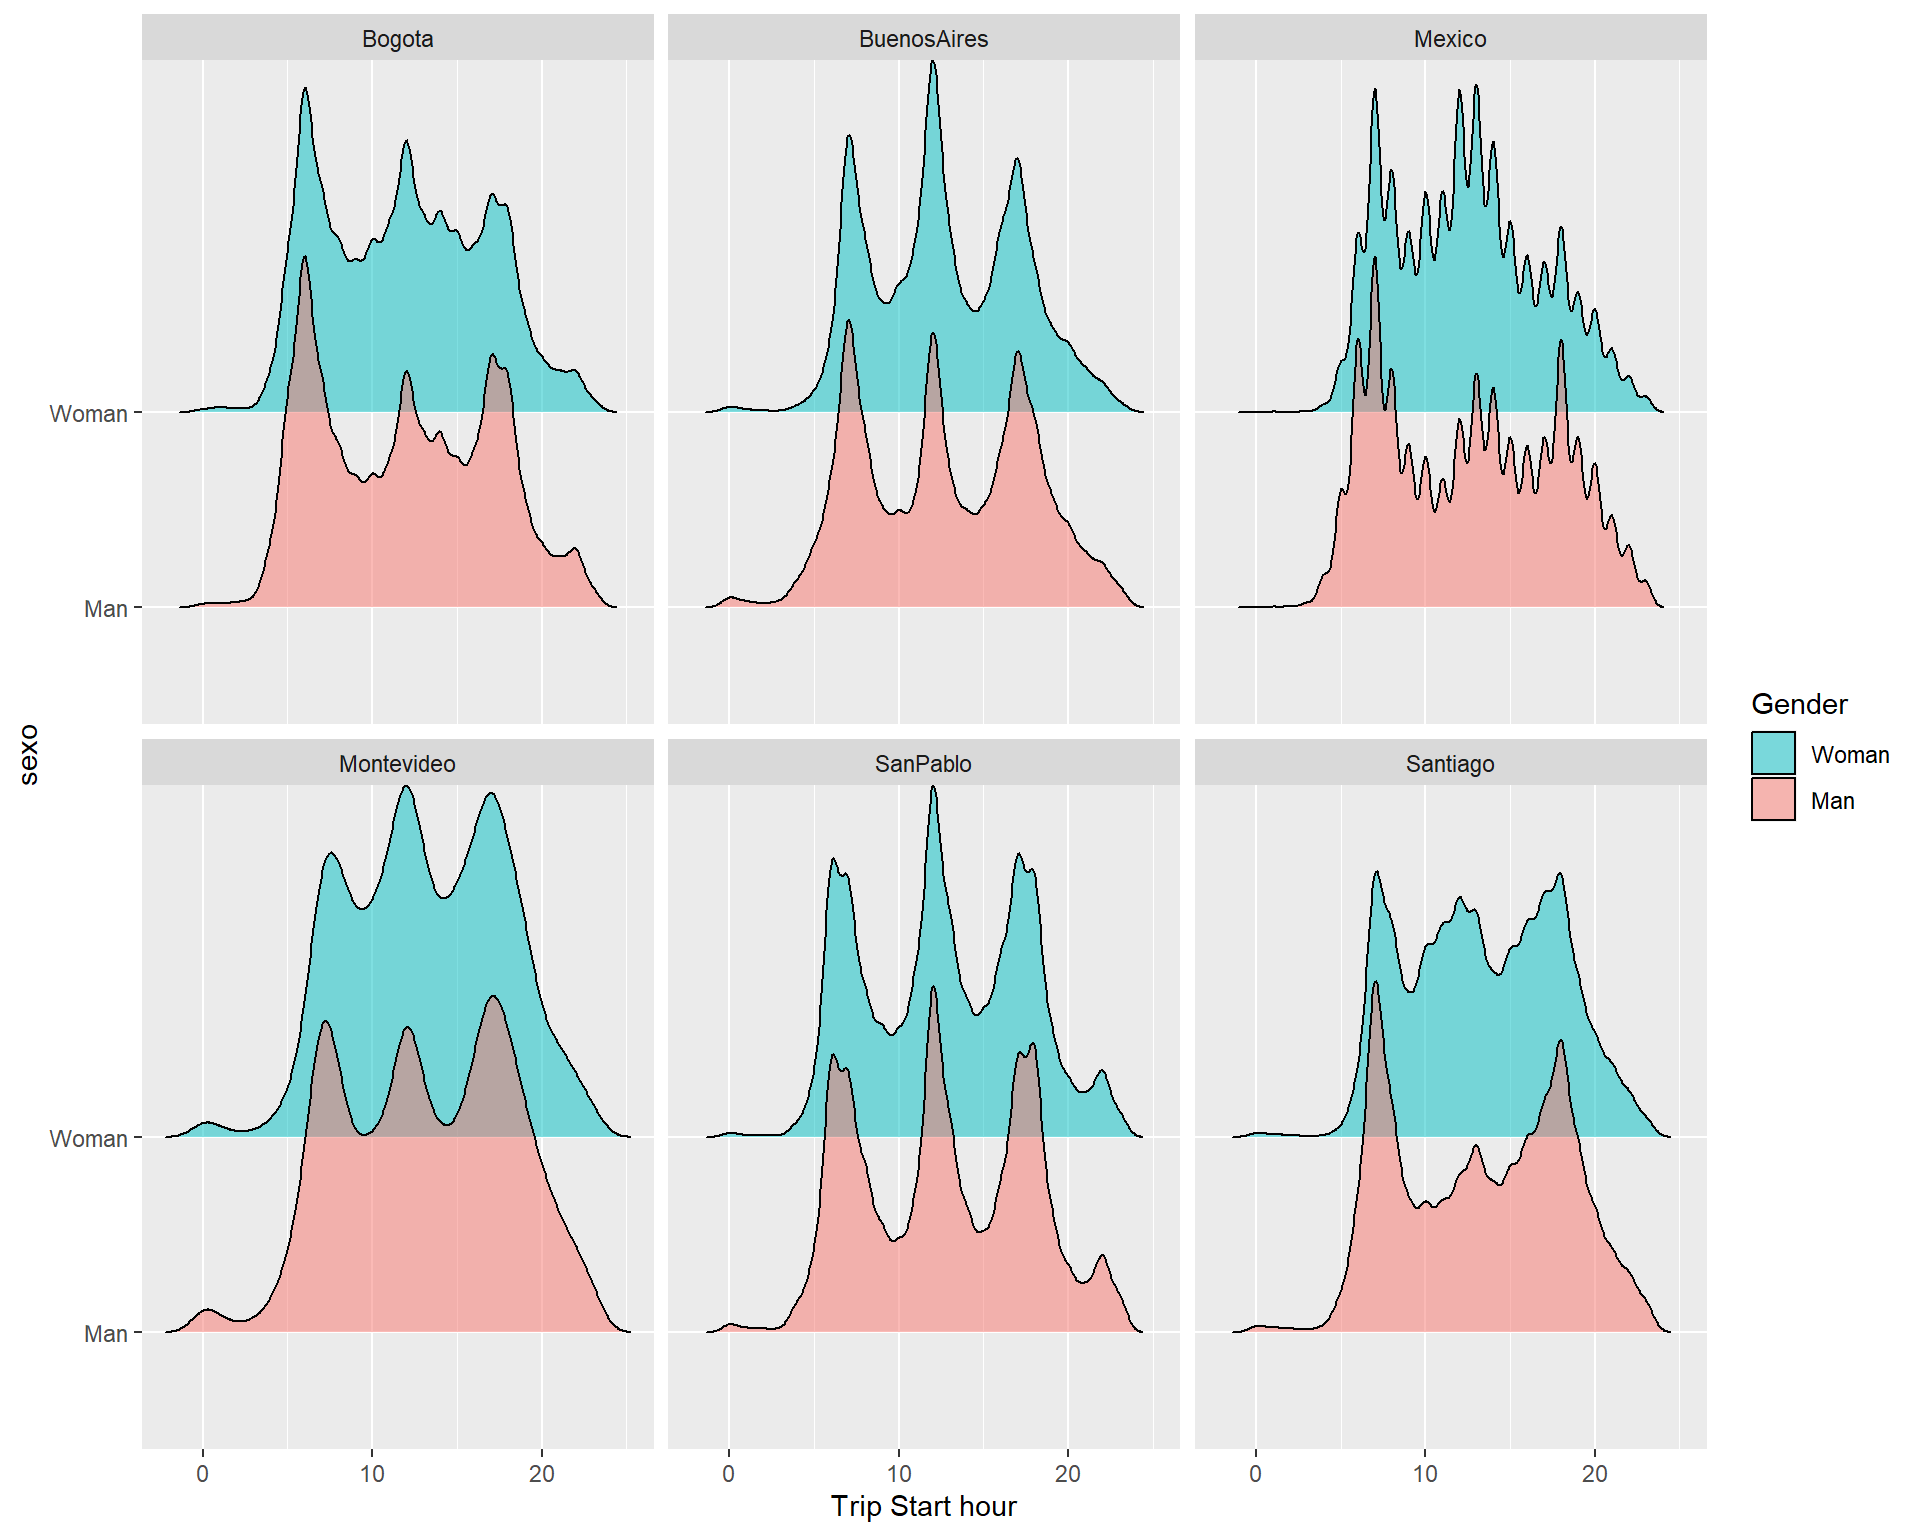
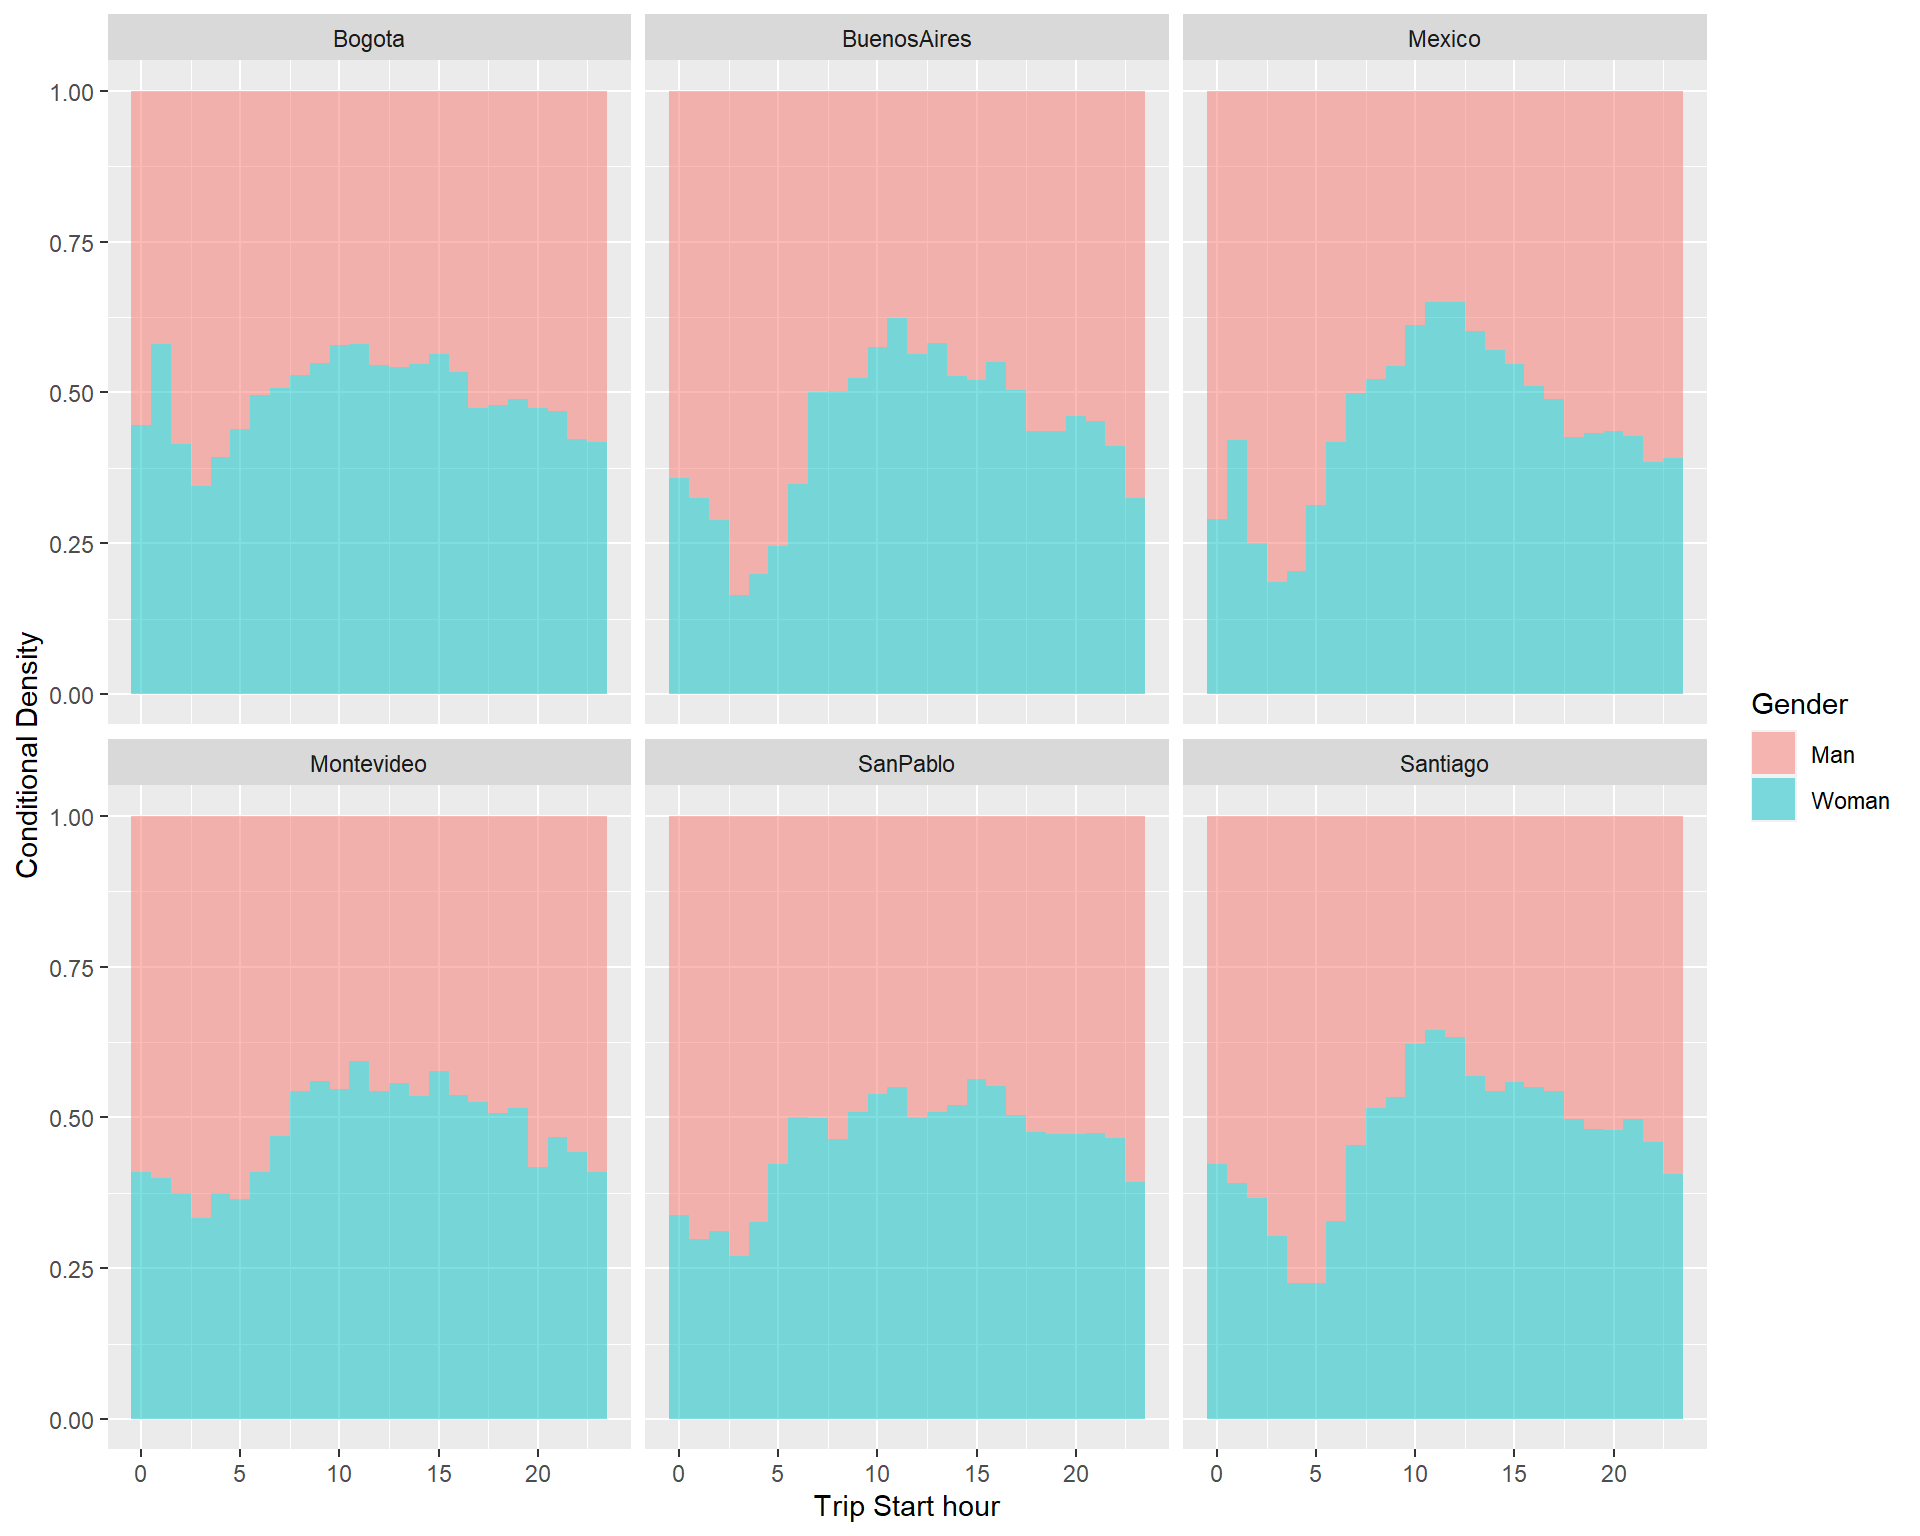
Both graphs do not show large differences between female and male schedules. In some cities, the middle peaks seem different for each group; for some cases the earlier peak seems more female-dominant, and the midday/evening peak more male-dominant, yet nothing overwhelming. The following plot shows the relative participation of each gender across time of day:
3 Age Group
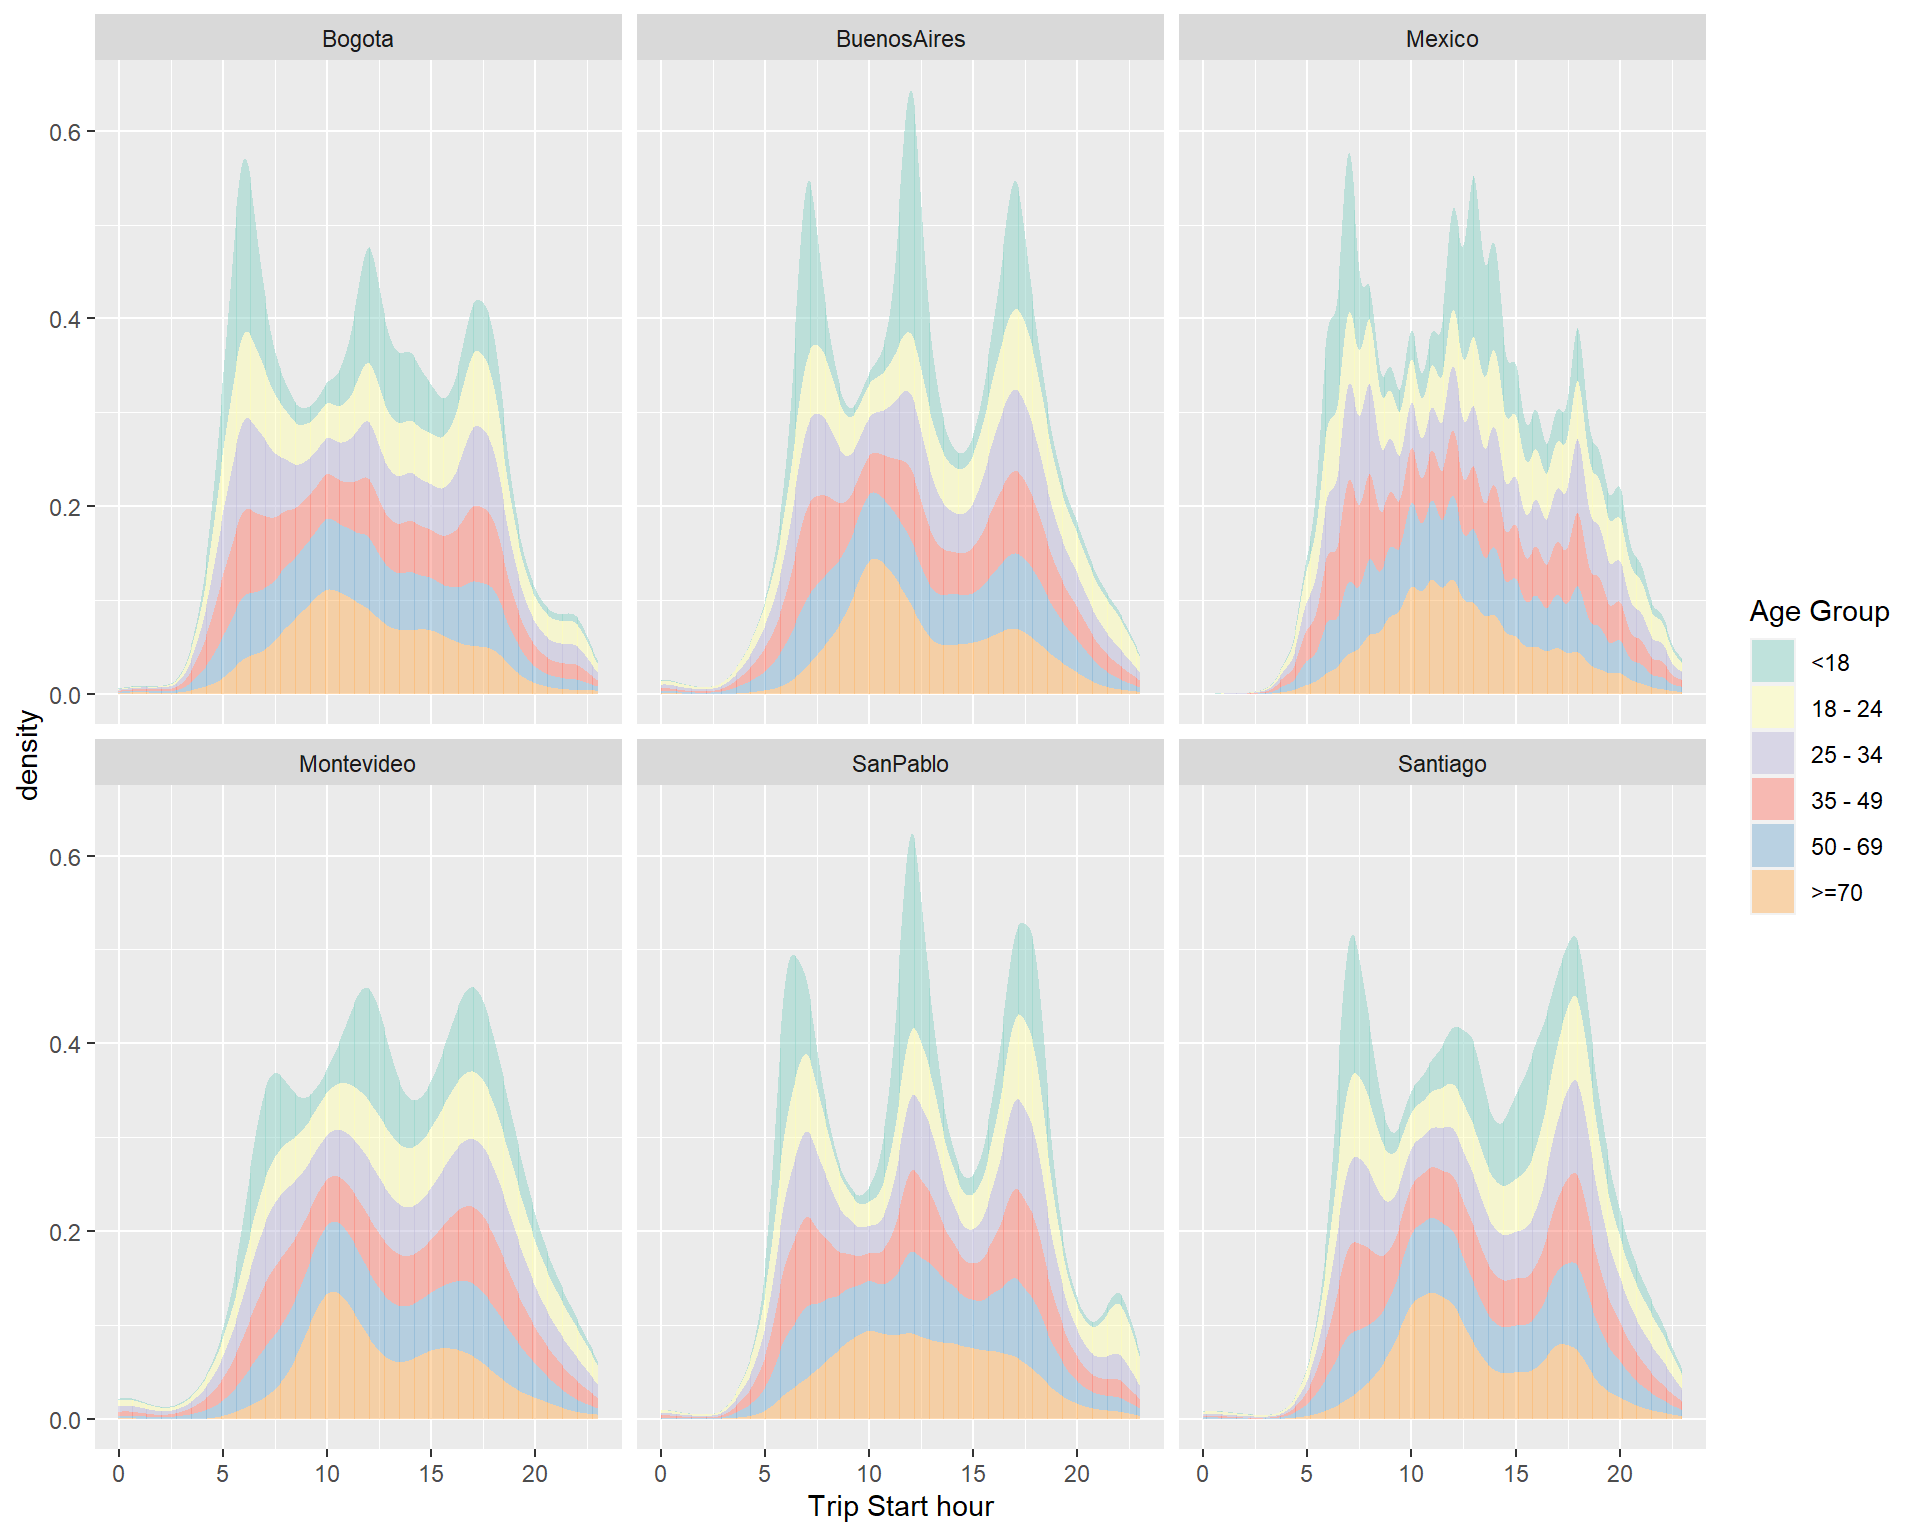
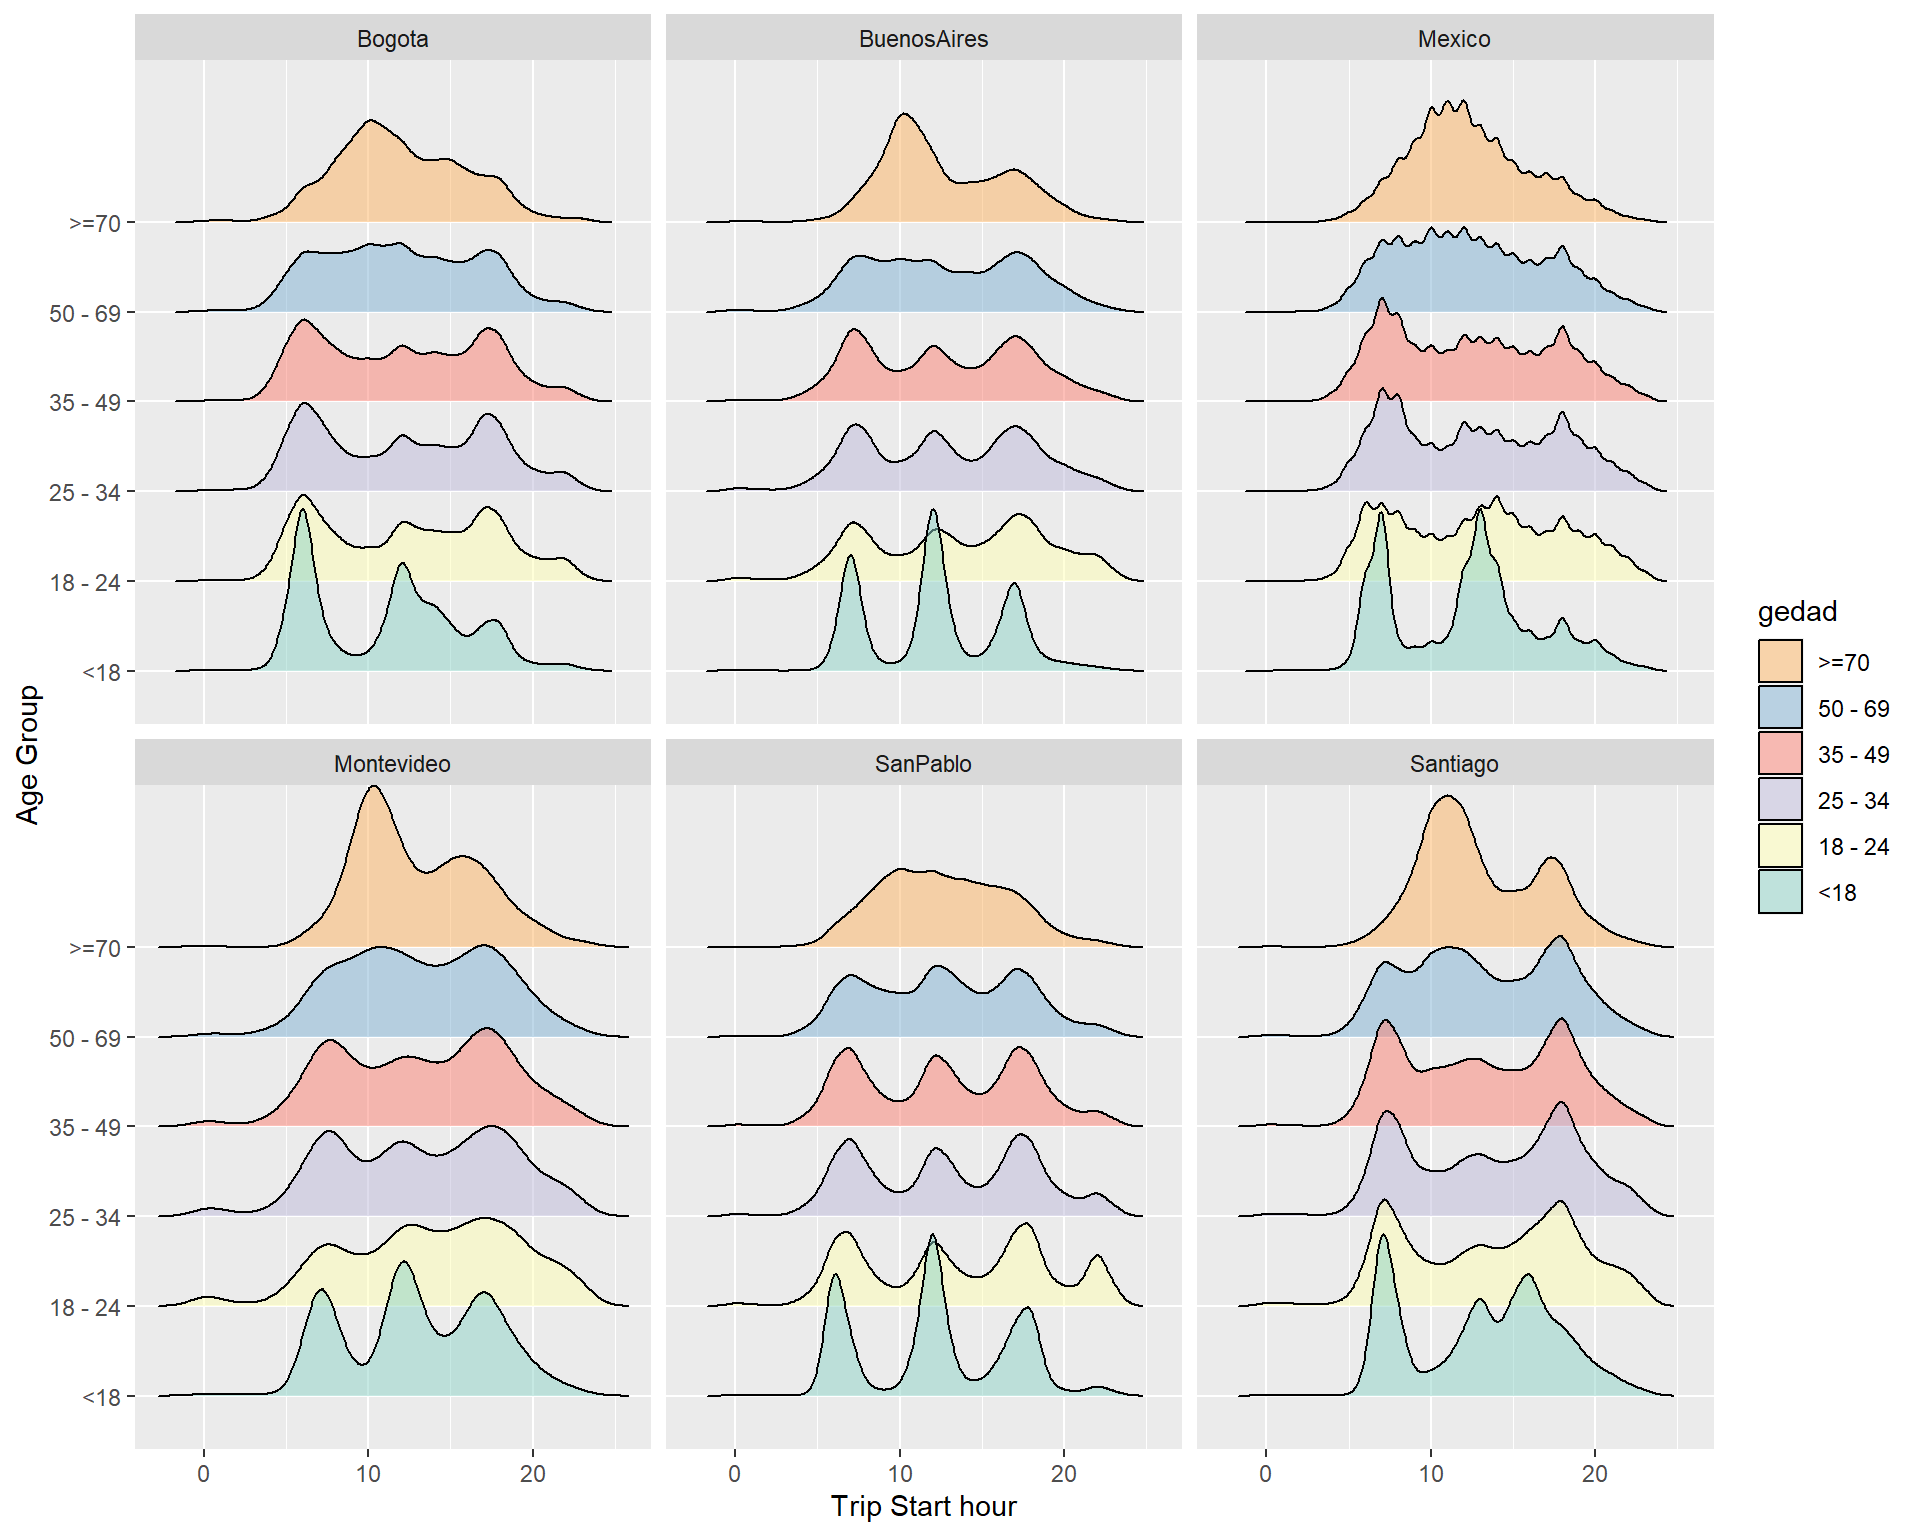
The younger group shows clearly the 3 peaks of the overall distribution, as well as the other working age groups. From age 50 onwards, it becomes more diffuse, and ages over 70 show a majority of participants in the middle peak.
4 Mode
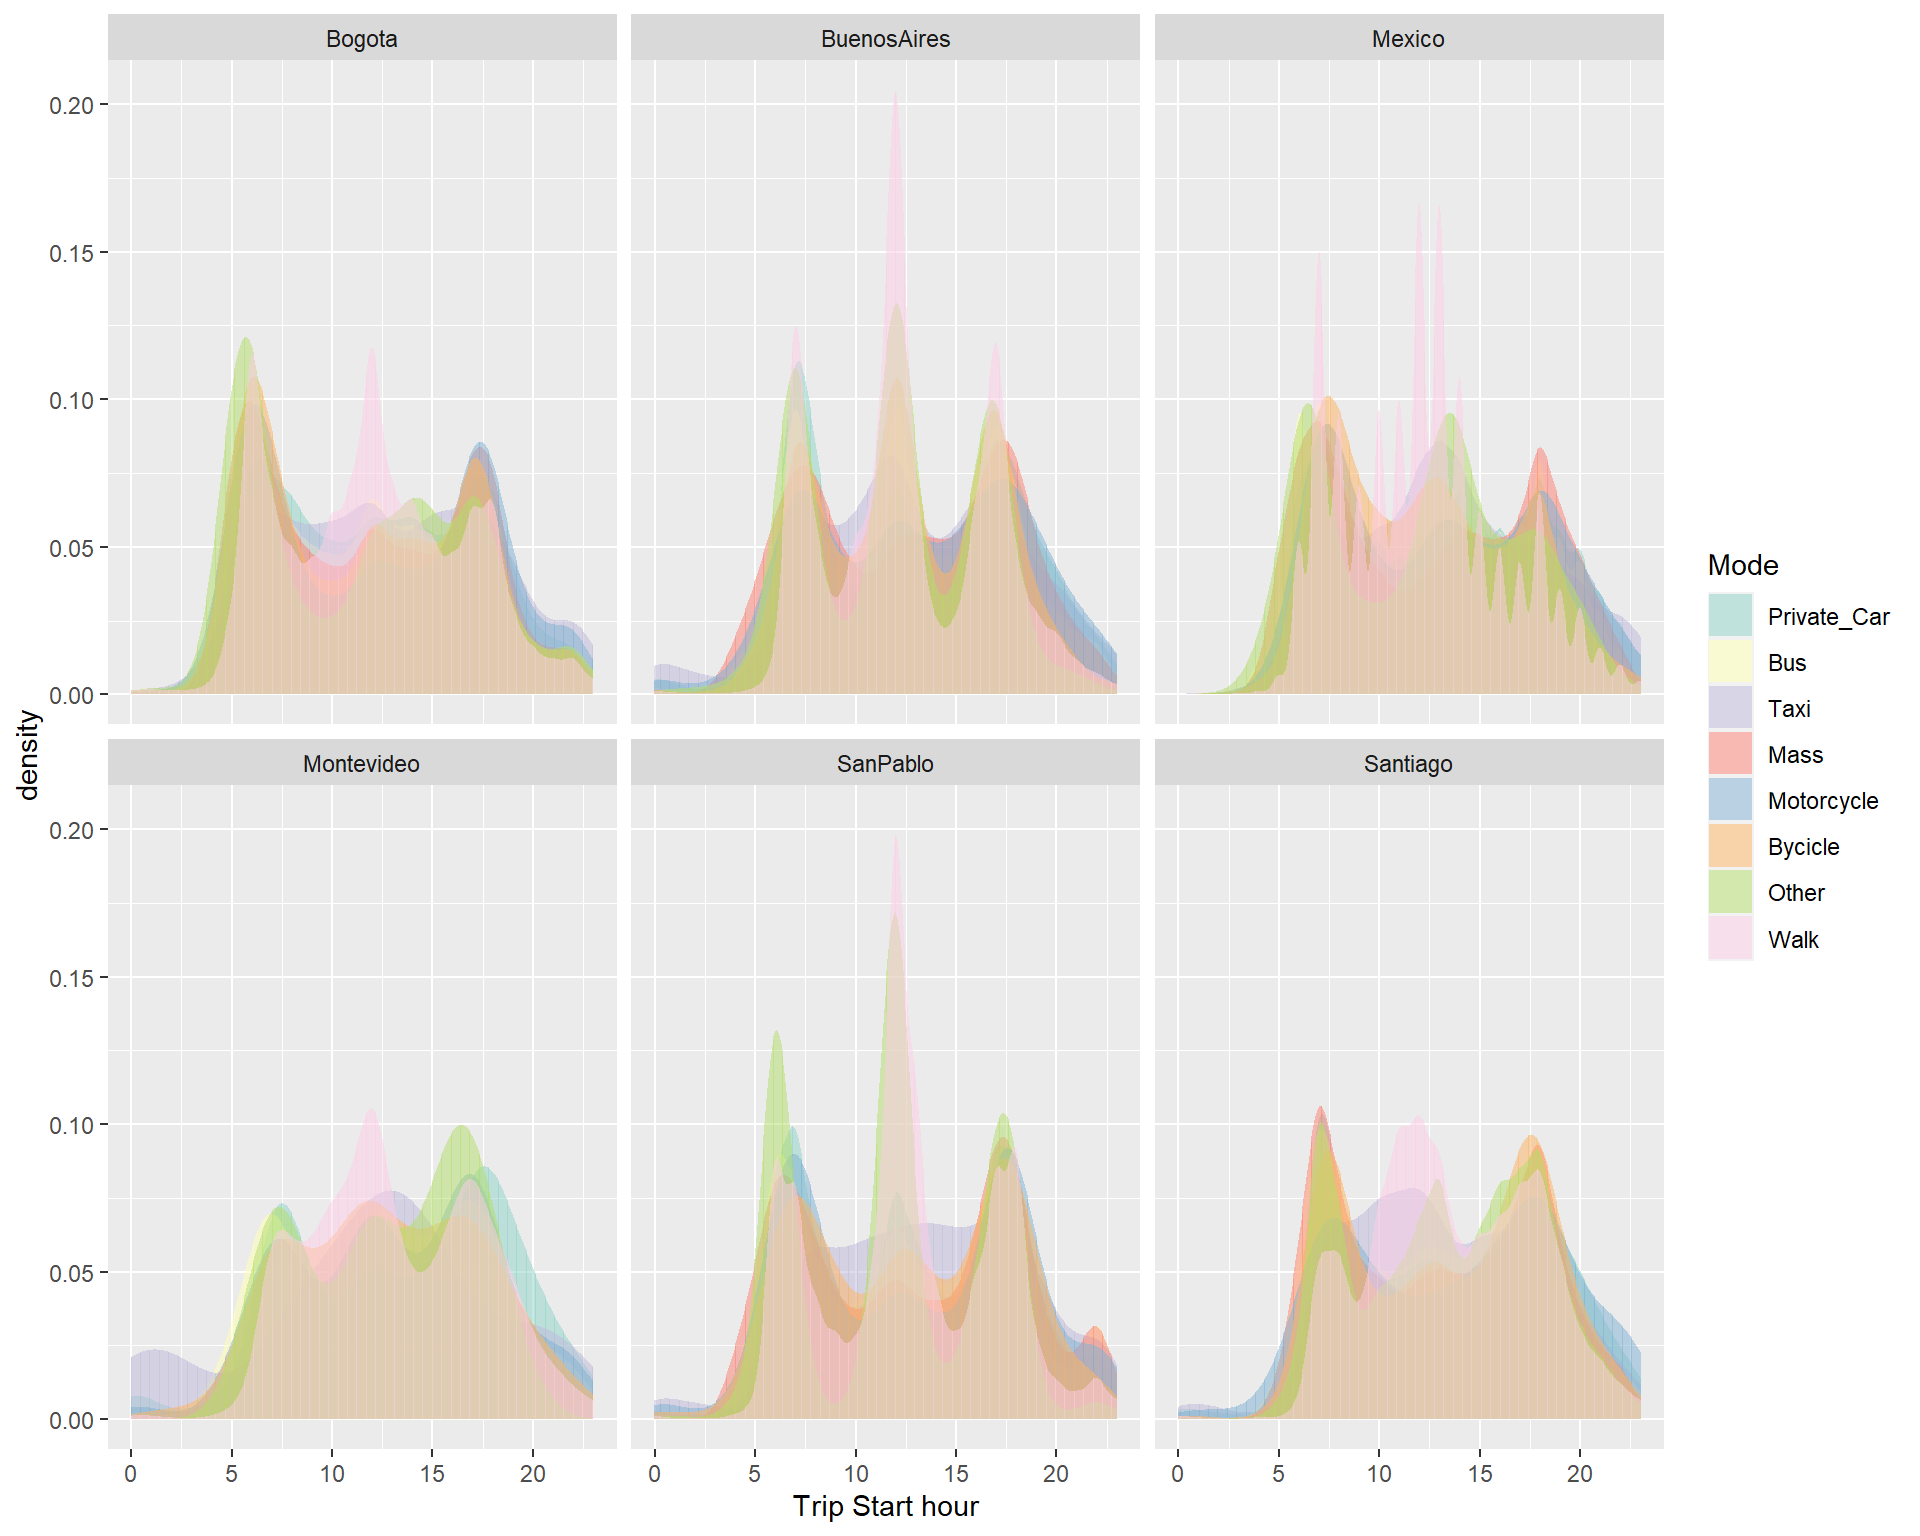
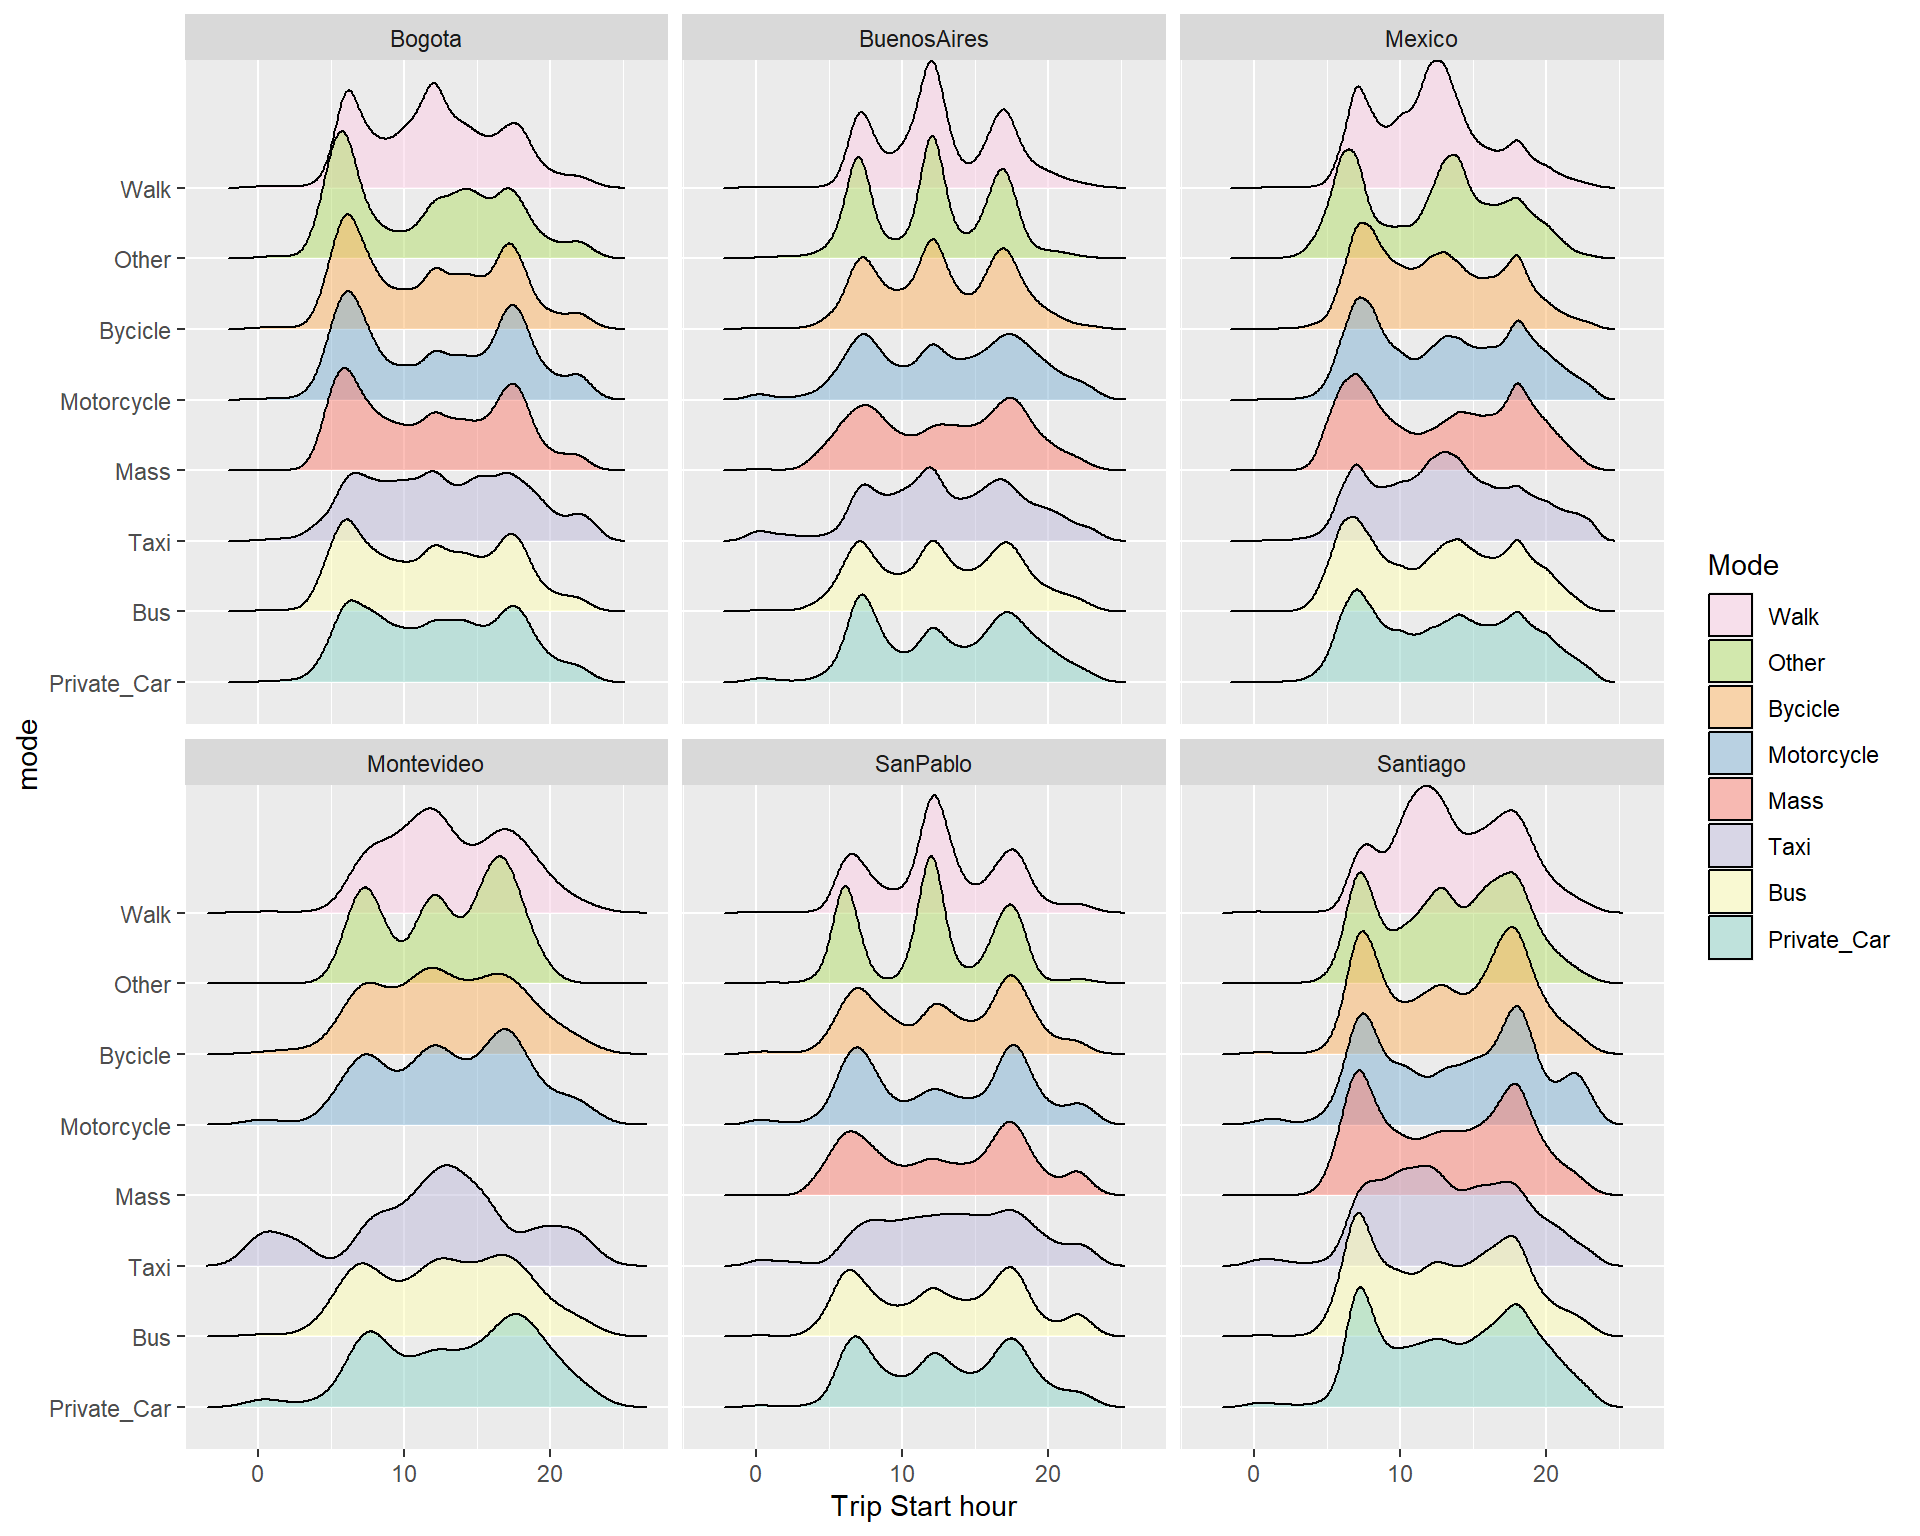 Observe walking as the main participant of mid-day peaks. The use of taxi as a plateau between working hours.
5 Motive
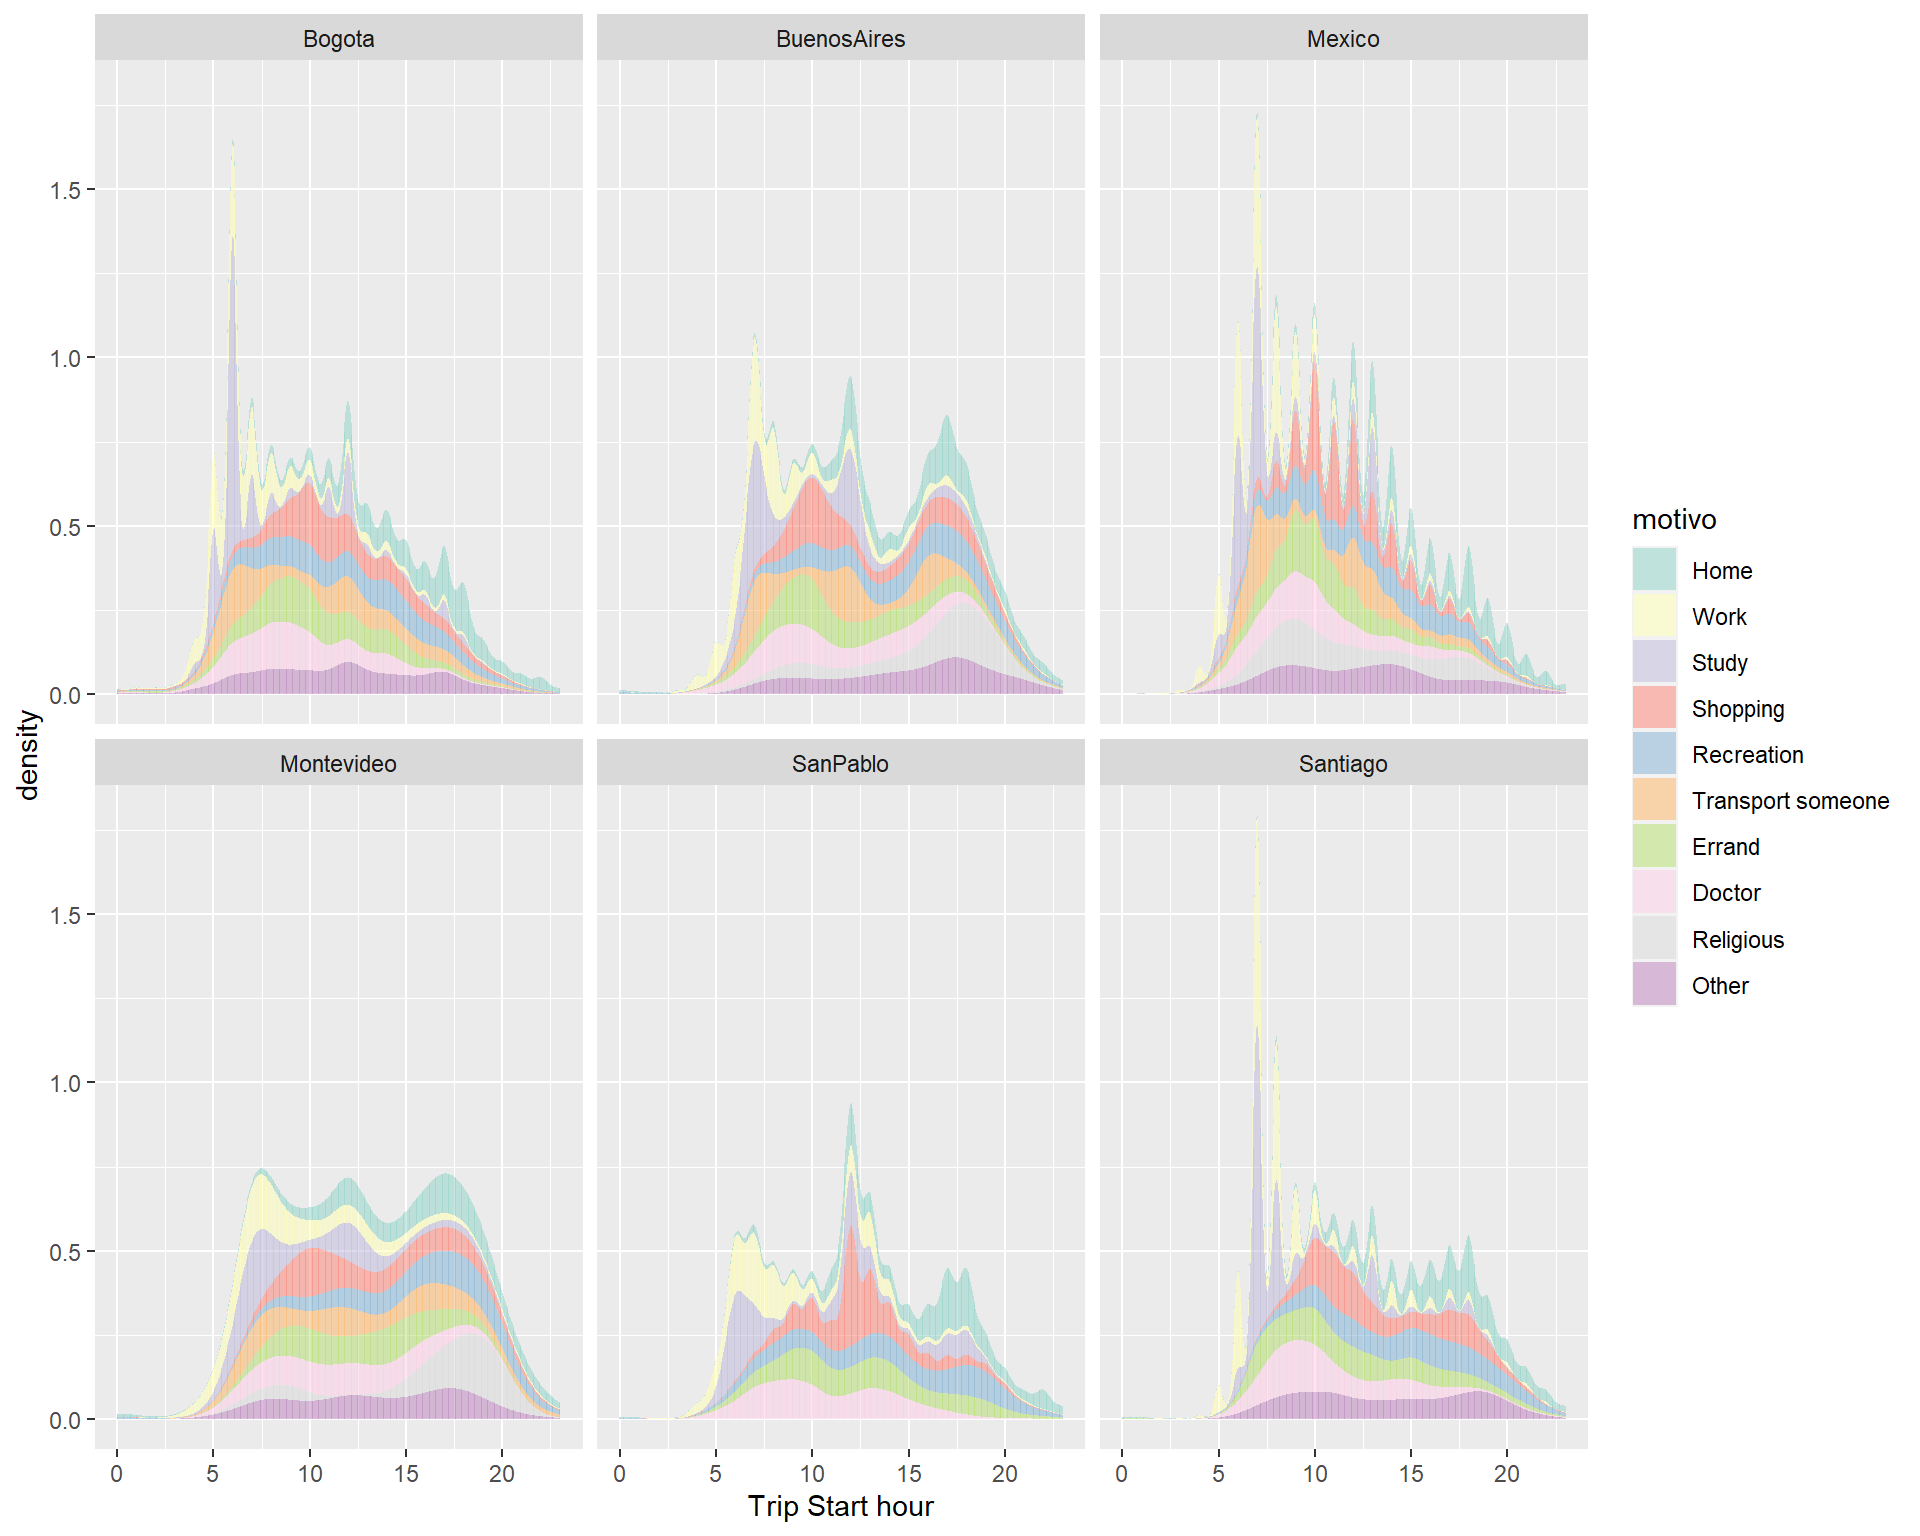
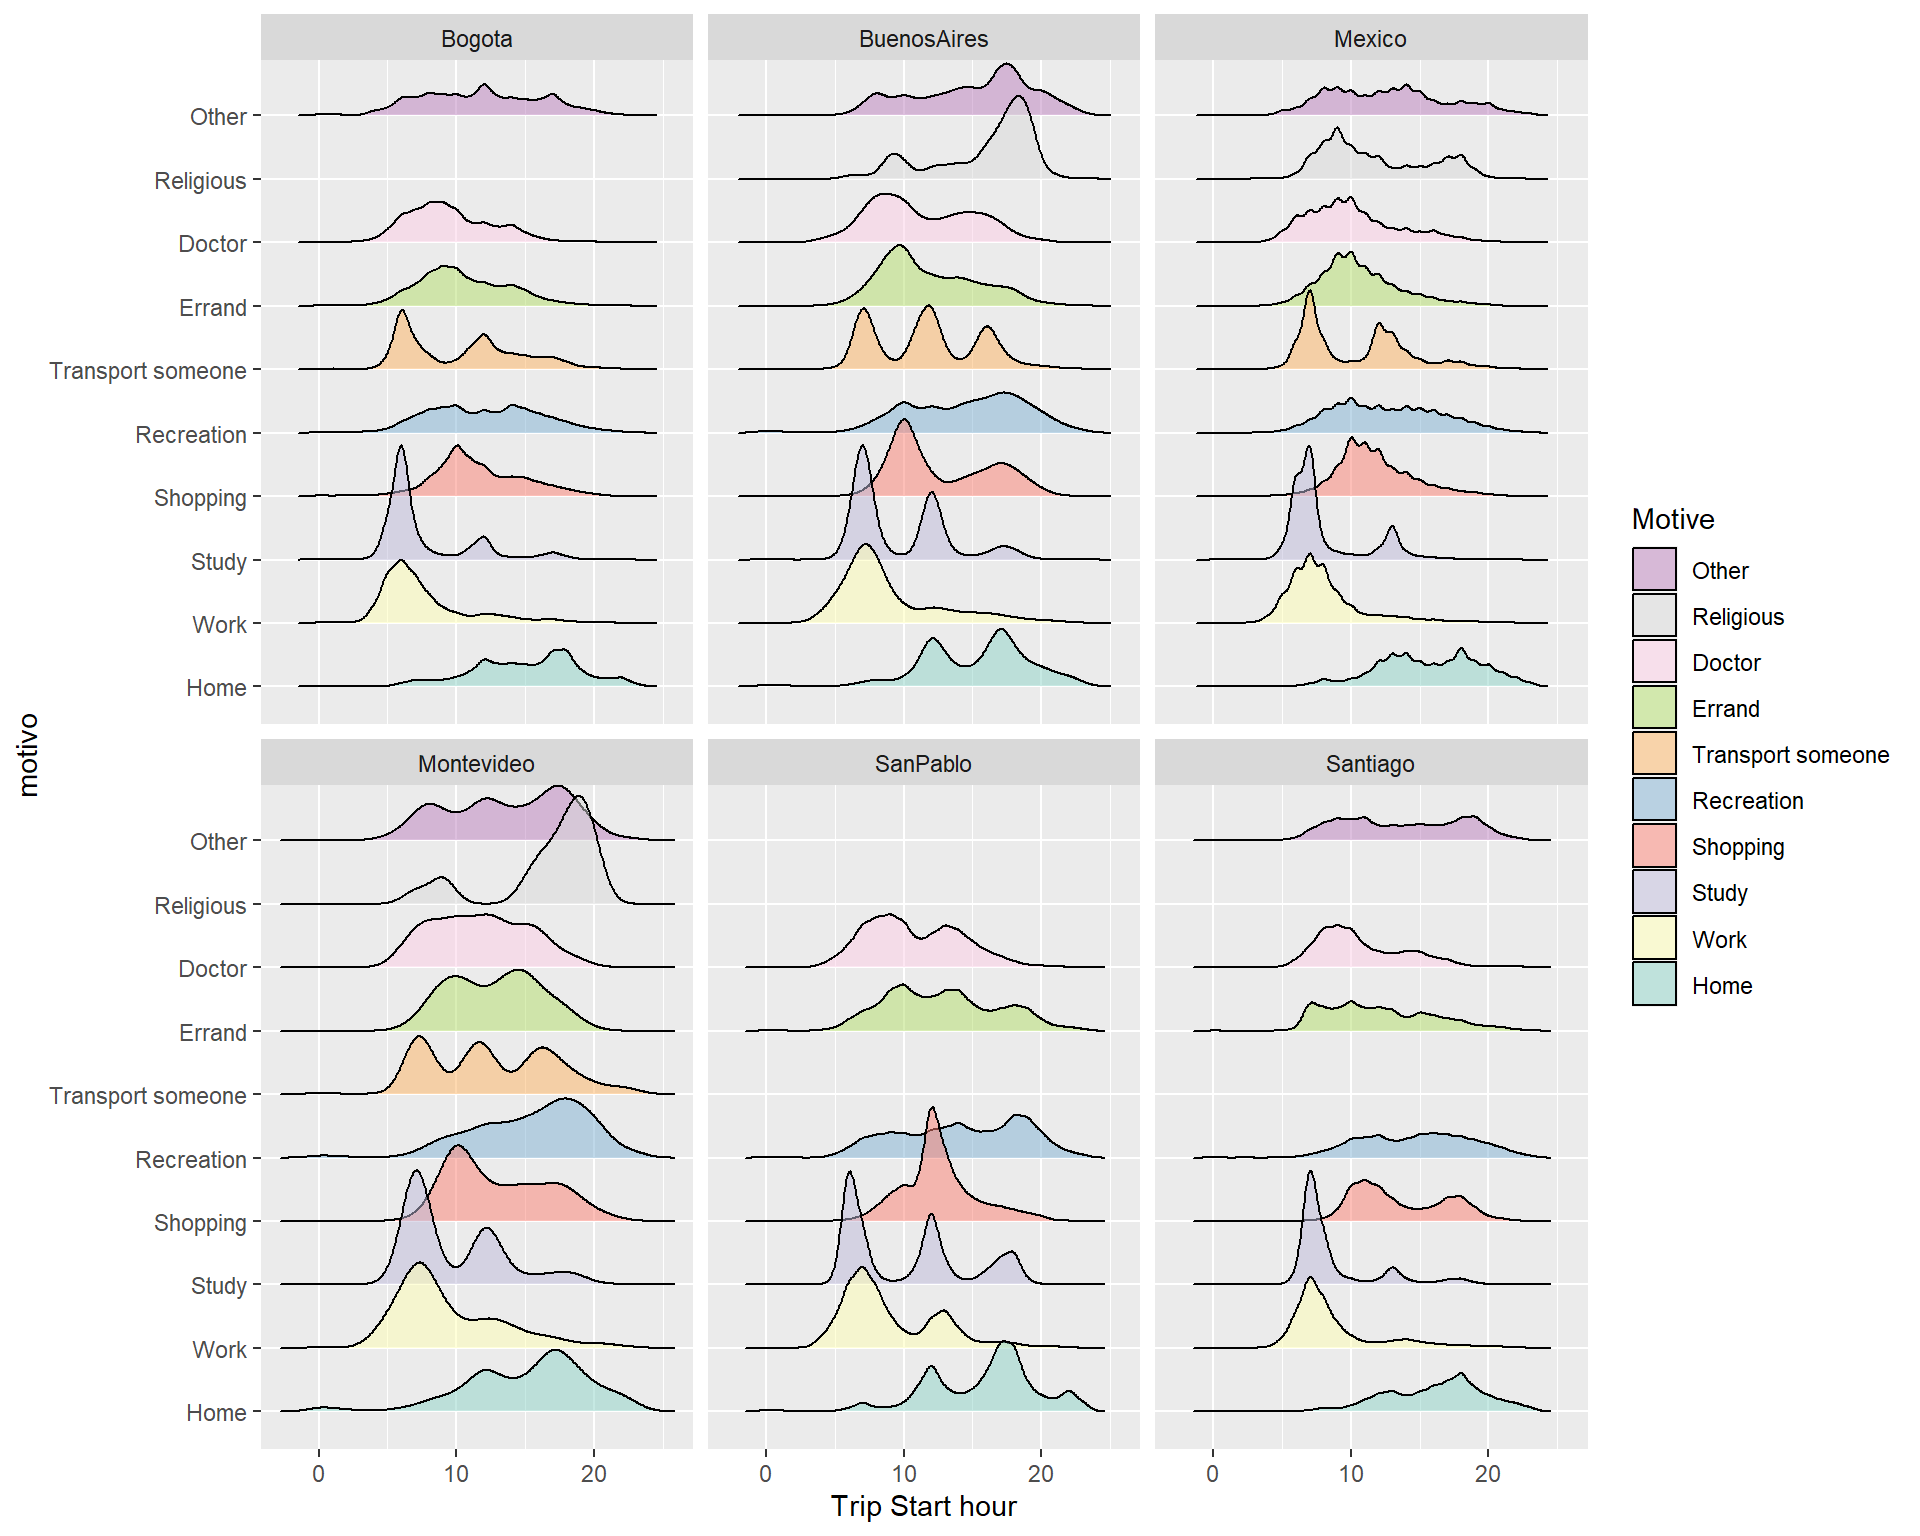
There are very clear patterns according to motive, not identical by city.
6 Socioeconomic Strata
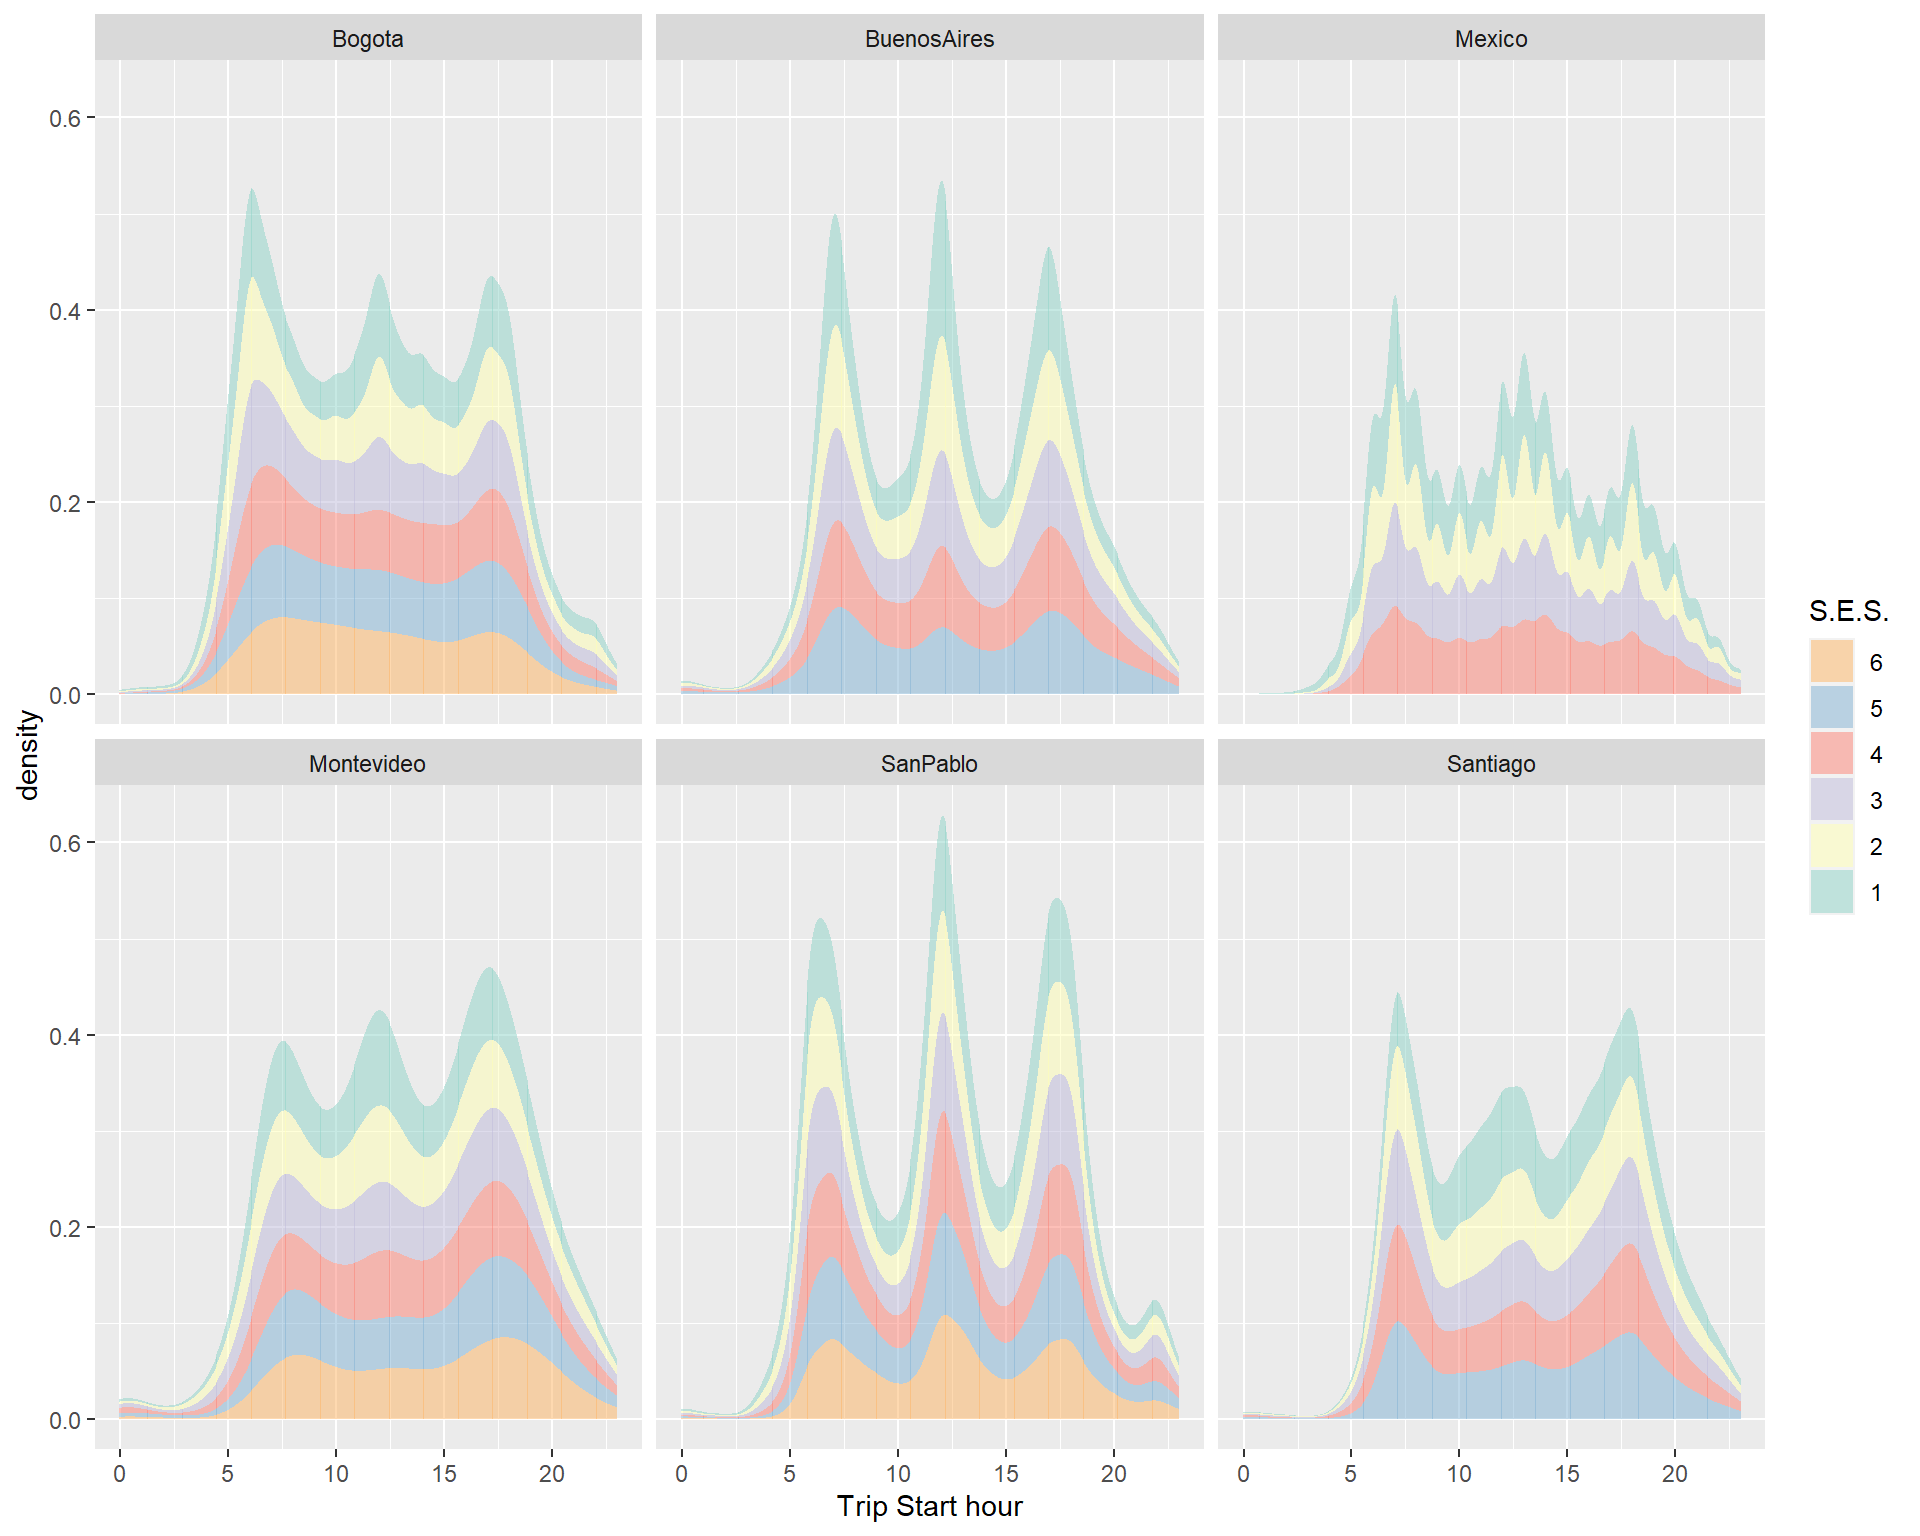
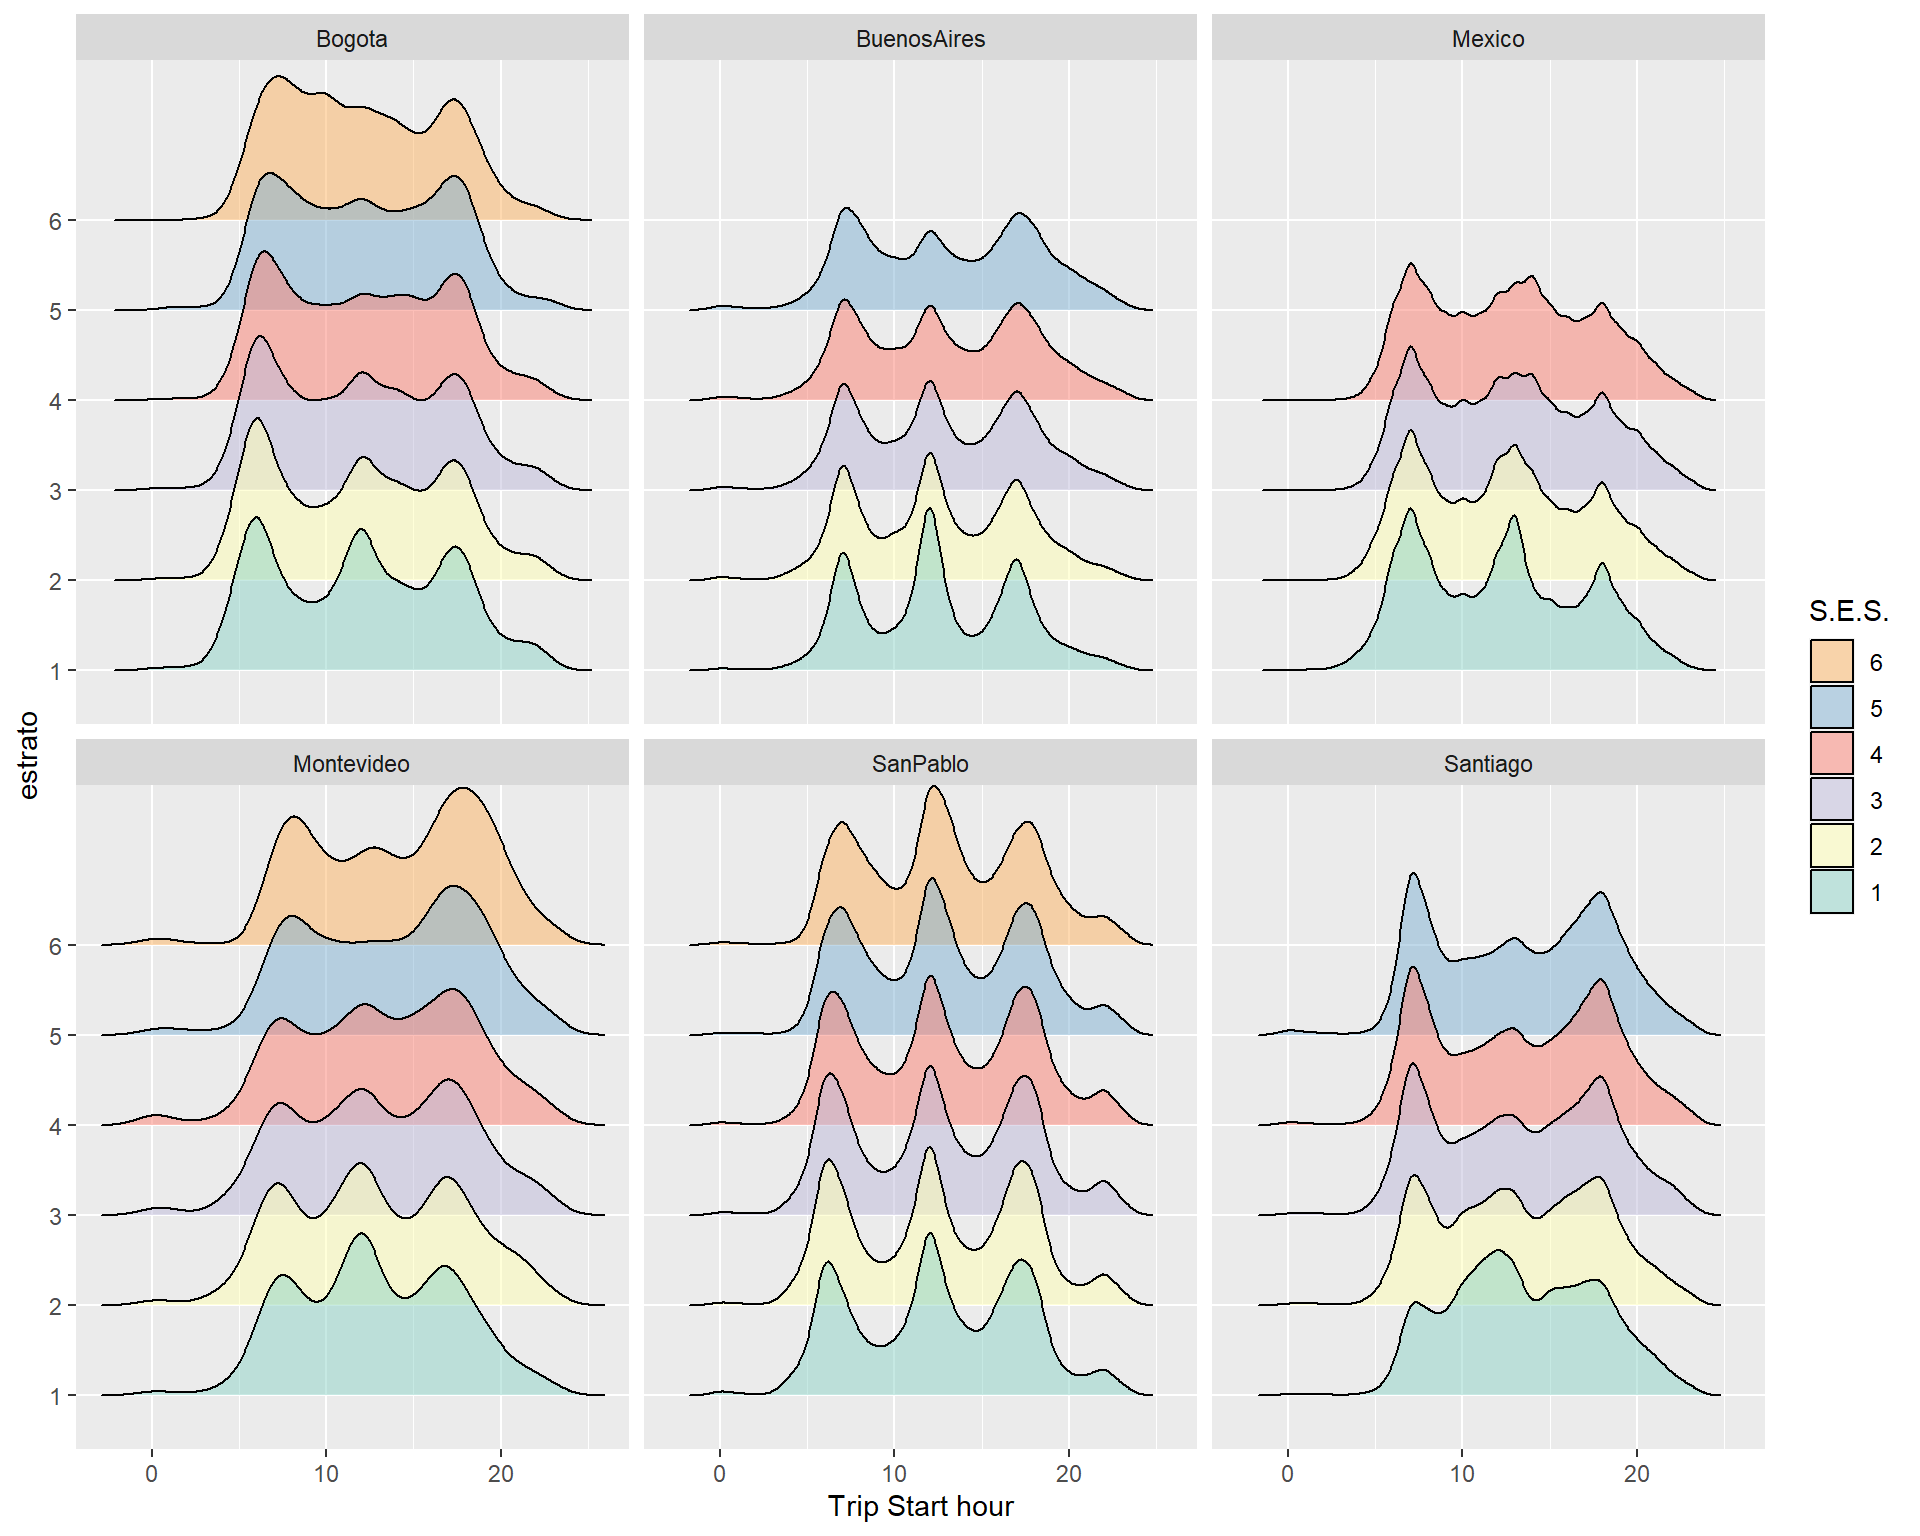
There is an interesting pronunciation of the mid-day peak in lower income groups.
7 Periphery
Post processing within the IDB tried to identified patterns for trips that were outside the limits of the metropolitan area. These were distinguished as originating outside, or bound for outside, of the city limits. Sao Pailo and Buenos Aires were excluded from this analysis due to the lack of geographical coordinates in the survey responses.
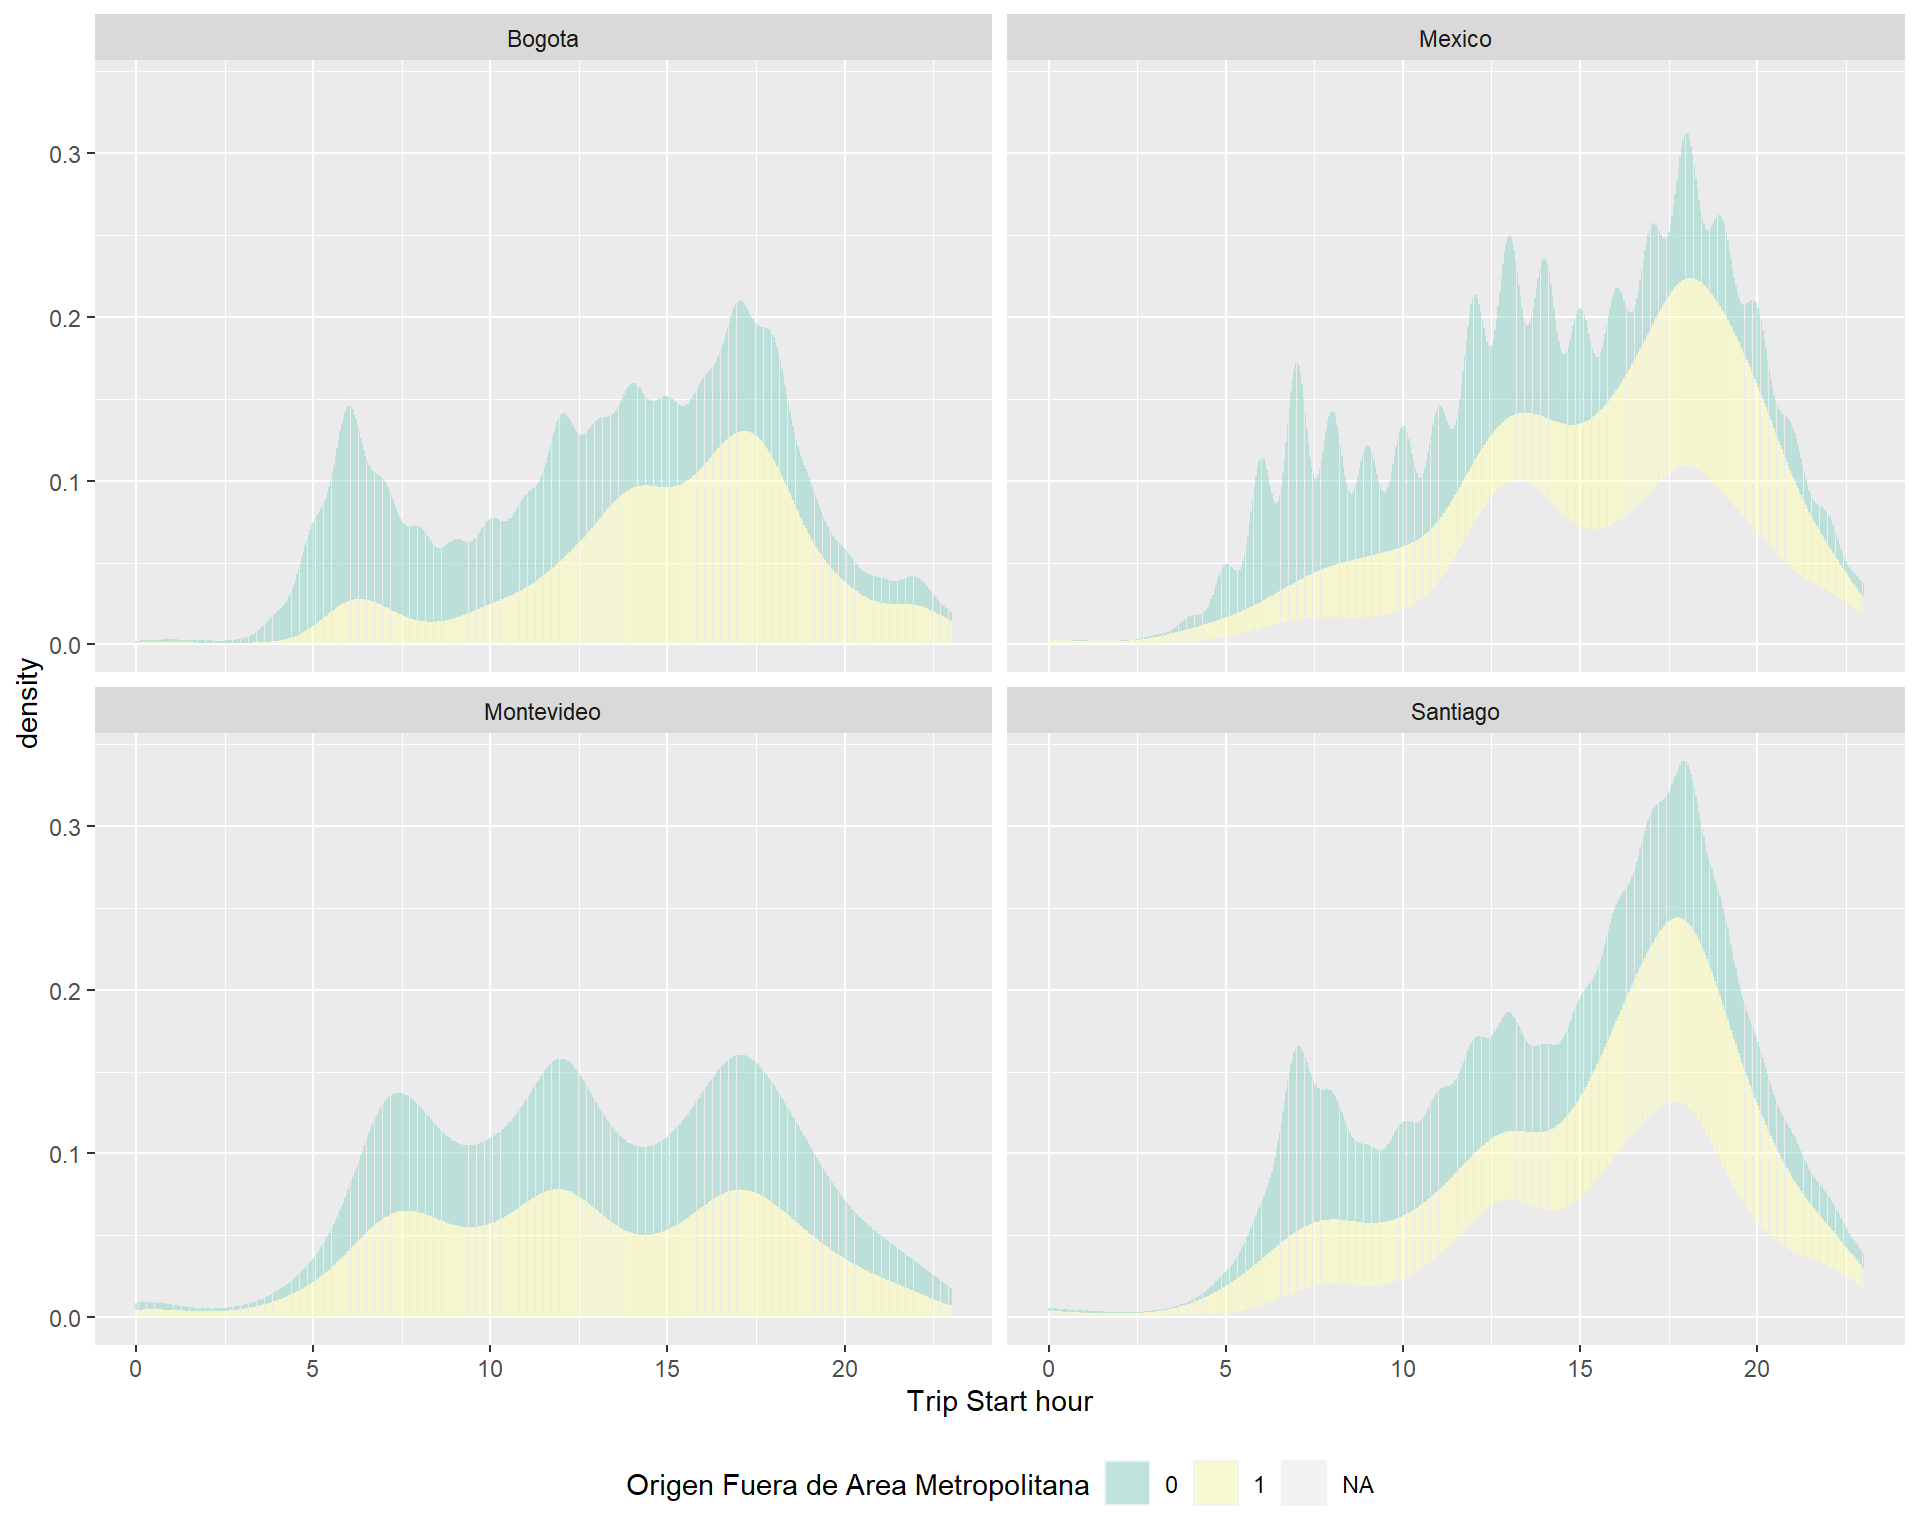
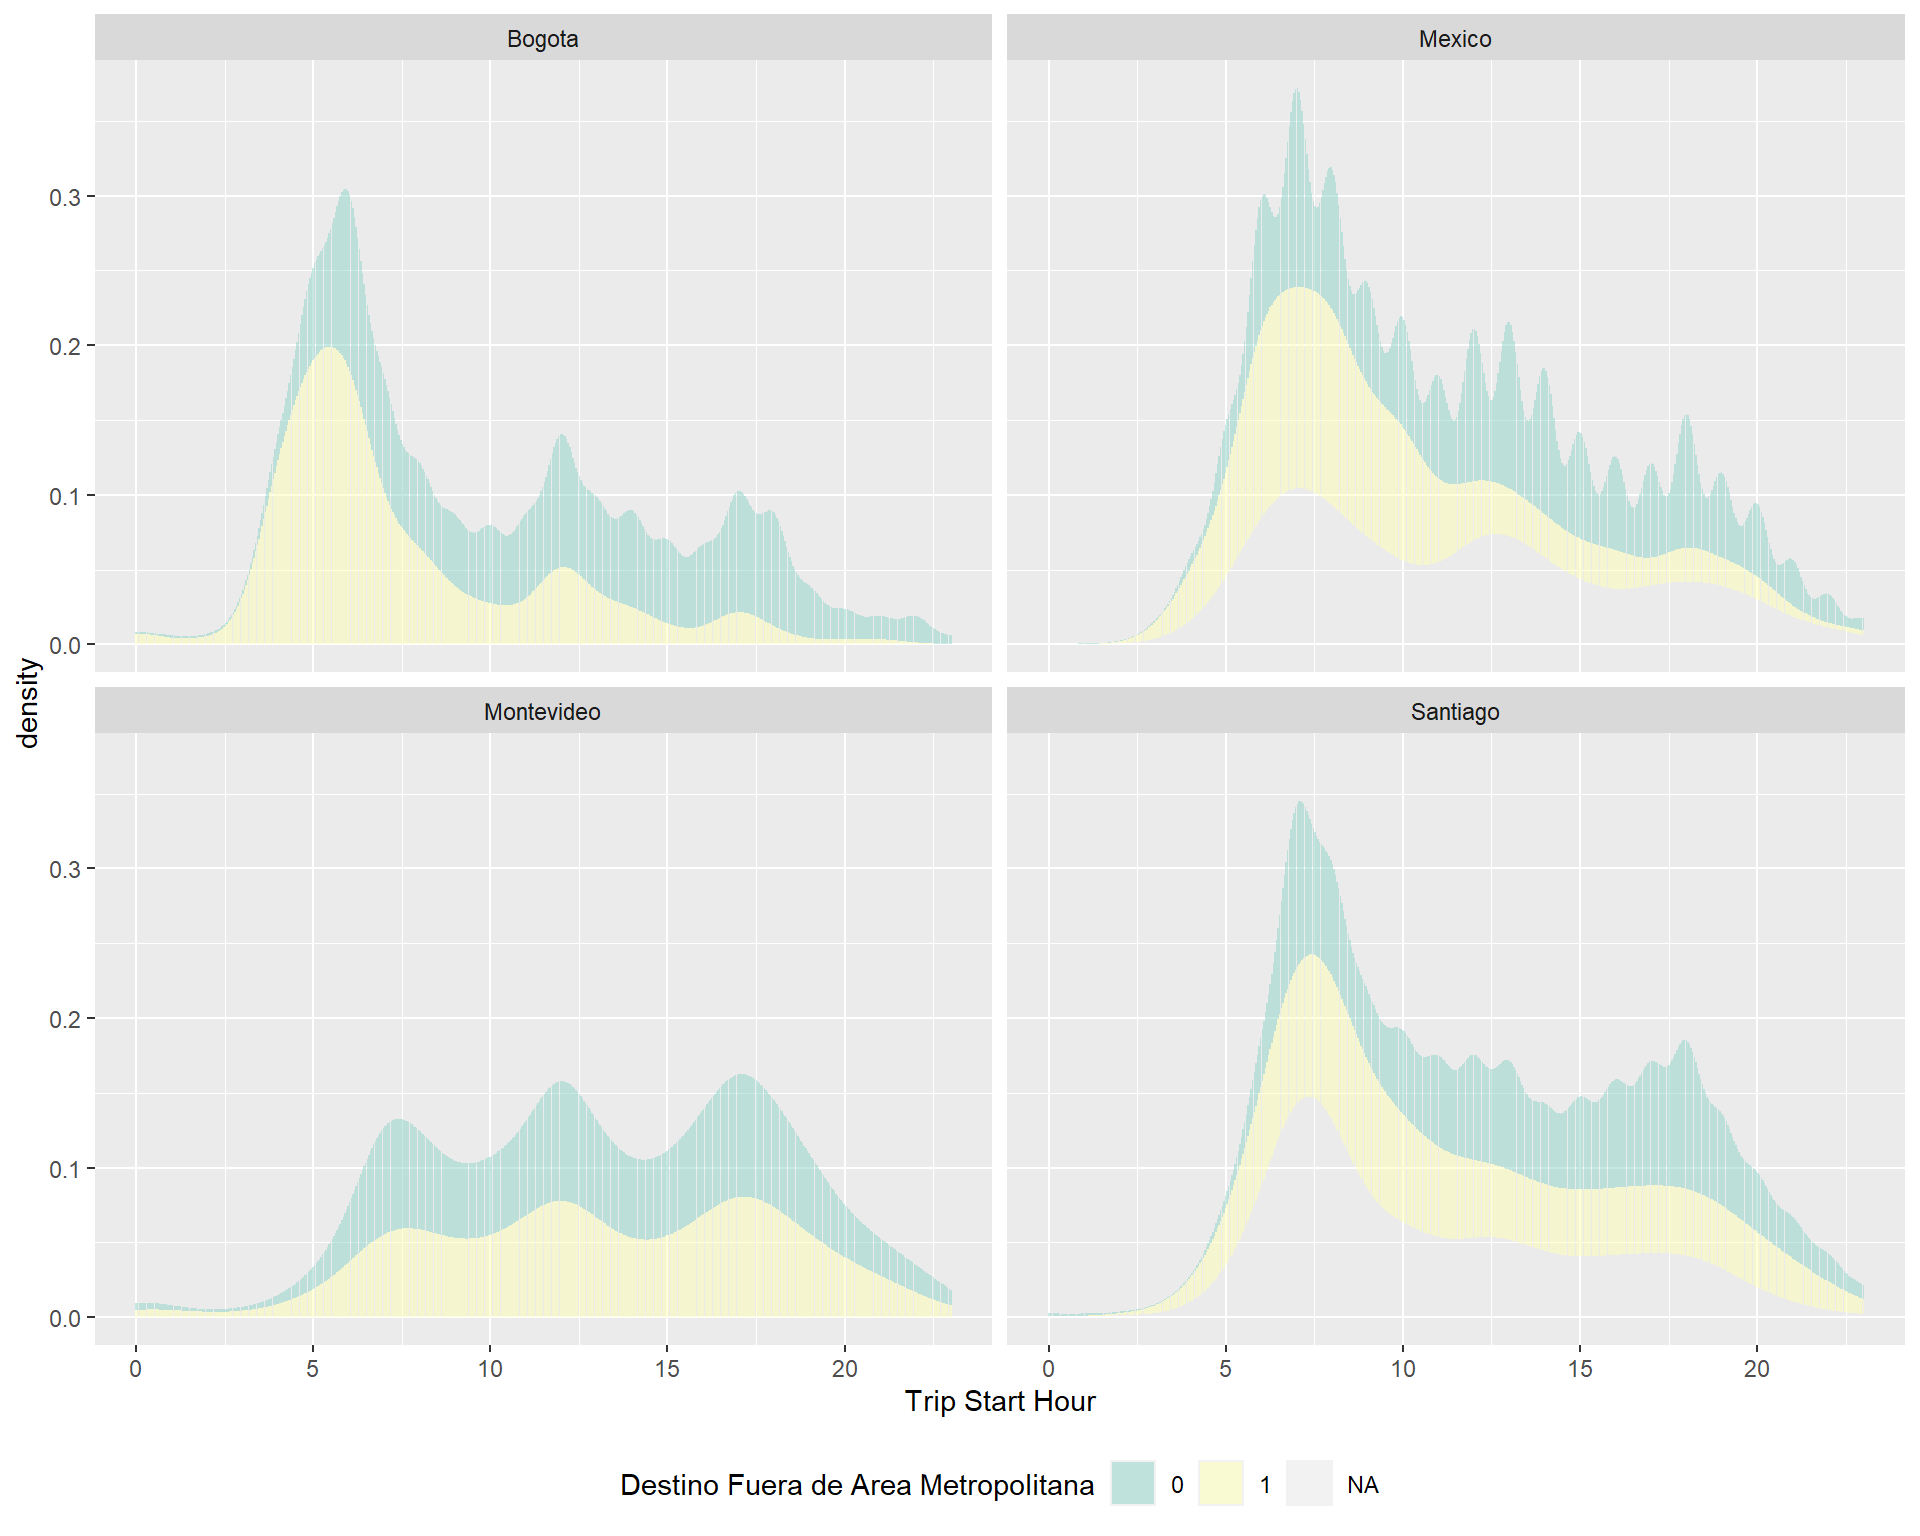
The city of Montevideo shows and equal distribution of these two groups with respect to the total of the trips. This may be owed to the city size. In the other three cases, trips with destination outside of the city limits are skewed towards an earlier time,